Skip to main content Skip to search Skip to main navigation
Menu

WinSTAT

WinSTAT is an Excel Add-On for statistical data analysis. It’s easy to use, powerful and cheap!
Description

Product information "WinSTAT"

WinSTAT – The Powerful Statistics Add-On for Excel

Perform statistical analysis directly in Excel

WinSTAT is a powerful statistics add-on for Microsoft Excel that enables seamless data management and analysis. Fully integrated into Excel, WinSTAT allows you to leverage familiar tools for data entry, visualization, and statistical evaluation—without switching between applications.


Why Choose WinSTAT?

Easy to use – Enter and manage data directly within Excel
Customizable – Save templates for charts and tables
Seamless integration – All results are returned as Excel tables and graphics
Export-friendly – Copy results directly to Word or PowerPoint (also via dynamic linking)
Reliable printing & exporting – No file conversion issues


Details

WinSTAT – The Powerful Statistics Add-In for Microsoft Excel

Professional Data Analysis Directly in Excel

WinSTAT is a powerful statistics add-in for Excel that delivers the capabilities of advanced statistical software—without complex commands or confusing menus. Fully integrated into Microsoft Office, it allows you to stay in your familiar Excel environment—no need to switch programs!


Why Choose WinSTAT?

User-friendly – Enter and manage data directly in Excel
Powerful statistical functions – Perform comprehensive analyses without complex syntax
Seamless integration – All results appear as Excel tables and charts
Customizable output – Save and reuse templates for consistent reports
Efficient reporting – Export directly to Word and PowerPoint (with optional dynamic linking)
Boost productivity – Instantly update results when new data is added
Cost-effective – Premium statistical functionality at an affordable price


WinSTAT vs. Traditional Statistics Software

Many conventional statistics tools complicate workflows with rigid data import processes, limited export options, and difficult-to-edit graphics. WinSTAT eliminates these hurdles by leveraging the power of Excel:

Direct data entry in Excel – No complex import steps required
Fast analysis – Access statistical functions via an integrated Excel menu
Flexible reporting – Results are instantly displayed as editable Excel tables and charts
Full customization – Modify colors, fonts, and layouts right in Excel


1-Step Productivity: Analyze, Report, Update

WinSTAT saves you time and simplifies your workflow. Unlike traditional statistics software, which often requires multiple steps from data input to reporting, WinSTAT offers a streamlined one-step solution:

🔹 Update data – Reports and analysis adjust automatically
🔹 Save and reuse templates – Create once, apply anytime
🔹 Optimal print & export quality – No manual formatting needed


Conclusion: Powerful Statistics Without the Complexity

With WinSTAT, you can perform statistical analysis quickly and efficiently—directly in Excel—without sacrificing the capabilities of full-scale statistics packages. And all at a highly competitive price!

📌 Learn more on the official WinSTAT website

Requirements
 Windows®
Andere VoraussetzungenExcel 2007 oder Excel 2010
Bitte fragen Sie nach, sollten Sie eine ältere Version nutzen.
BetriebssystemAlle Windows Versionen
Minimum CPUPentium oder vergleichbarer Prozessor
Min. RAM16 MB RAM (64 MB oder mehr empfohlen)
Festplattenplatz12 MB freier Speicherplatz auf der Festplatte

Details

WinSTAT - The Statistics AddOn for MS-Excel

Why WinSTAT? Good reasons for working with WinSTAT:

  1. A wealth of statistics functions
  2. Microsoft Office working environment
  3. Freedom of design using user defined templates
  4. Just a few clicks to a comprehensive report
  5. Low Price

A Wealth of Statistics Functions

Can a program like WinSTAT compete? Convince yourself that WinSTAT offers the functionality you need by glancing through the function reference list (see additional "Further Information"). And yet WinSTAT isn\'t overloaded with complicated options or command sequences. Everything you need can be specified via the easy-to-use menu and dialogs.

Microsoft Office Working Environment

Do you work with Microsoft Office? Then you almost know WinSTAT for Excel!
Did you experienced one of the following difficulties with other statistics programms?

  • Troublesome data input:
    it often seems easier to enter the data using another program and then import. And still you have to fix things by hand. With every change of data the process starts over again.
  • The calculations are correct, but what do you do with the numbers?
    They must either be printed or integrated into a report. With its printing problems and export problems your program just doesn\'t seem to be state-of-the-art.
  • Graphics can be created, but they can only be customized using compicated dialogs.
    Printing and exporting is even more of a problem.

WinSTAT for Excel solves all of these problems!

  • Input your data directly in Excel, or use Excels import functions.
  • Choose your statistics functions using the Add-In menu right in Excel. You never need to change programs.
  • All results appear as Excel tables and Excel charts. You have all of Excel\'s customizing features at your fingertips. Printing problems and export problems belong to the past. And integrating your results into a report is what Office is all about. You can copy to Word or Power Point and even dynamically link the results to your report.

Freedom of Design using User Defined Templates

All WinSTAT results appear as Excel tables and Excel graphics. At first, each kind of report has its own standard look. Now let your creativity show what it can do! You want to emphasize certain values using background colors or special fonts? You want to change the graphics colors and symbols for a presentation that reflects your design tastes? You want to insert your company logo? You have the entire power of Excel to customize your reports. The best news: Once you\'ve found a report form you like, just store it as a template. The next time you want an analysis of the same type, just choose the desired template from the combo-box. That\'s productivity!

Just a few Clicks to a Comprehensive Report

You know how long it can take to get from data entry to a report ready for printing. Do you often have to create a completely new report even though nothing has really changed except the input data? Or you would like to repeat an analysis using a subset of the original data? Even WinSTAT can\'t do all the work for you the first time. But look what it can do the second time through by cutting five steps down to one!

The 5 steps from Data Entry to the Finished Report:

  1. Data Entry
  2. Analysis Specification
  3. Results
  4. Customizing the Results
  5. Inserting into the Report (e.g. Word)

With WinSTAT you\'ll go through all 5 steps only once, because WinSTAT keeps a record of all the steps. Now benefit from WinSTAT\'s One-Step-Solution: Change the Data or enter new Data The change is visible immediately, right through to your finished report. This innovative feature can save huge amounts of time.

The Low Price

WinSTAT for Excel is very inexpensive. An incredibly good buy.

Further Information:

  Windows®
Further Requirements Excel 2007 or Excel 2010
Operating System All Windows versions are supported
Min. CPU Pentium
Min. RAM 16 MB RAM
Disk Space 12 MB
Skip product gallery

Recommended

Minitab
Minitab is a powerful statistical software for statistical analysis of data e.g. in research and quality management. Using an interactive wizard, the program offers a comprehensive range of statistical methods and graphical tools allowing to perform safely and successfully the steps of an analysis. Therefore, it is useful for industry, research, development and teaching.The system environment facilitates the steps from data import to 2D and 3D data visualization up to data exploration and analytical statistics. The project management, reporting and documentation of the results are logical and flexible to handle.Minitab is used worldwide for the implementation of Six Sigma projects and provides standard statistical methods, ANOVA, regression, quality tools, quality control charts, life cycle and reliability analysis, measurement system analysis, process capability analysis, design of experiments (DoE), excellent graphs and much more.Minitab shows an extreme adaptability, supported both by the integrated programming language allowing to automate processes and by the option to compile menus individually. Thus, it is not only possible to define company-wide standards, but also to adapt Minitab to the company's needs, giving the users only those analysis at hand which is actually needed.Arguments for Minitab:Minitab offers a comprehensive range of statistical methods and graphical toolsMinitab supports you in all phases of a Sig Sigma processMinitab is very adaptable and programmable Minitab - The 'All-In-One' Statistical and Graphical Analysis Software PackageMinitab is one of the leading providers of statistical software and services for quality management, education and research.Minitab provides precise but easy to use functions for quality management and general statistics. Minitab is used by plenty of leading companies like General Electric, Ford Motor Company, General Motors, 3M, Honeywell International, LG, Toshiba, Nokia and many leading Six Sigma consultants.As an introduction to statistics, Minitab is also established in more than 4.000 technical schools and universities. Minitab's head office is located in State College, PA, USA and has branch offices in the UK, France and business partners across the whole world.Interactive Assistant for smooth AnalysisMinitab gives you the confidence you need to improve quality, with features like an interactive assistant that guides you through your analysis. It is specifically designed to help you succeed at every step of your analysis. Once you've chosen the right tool, the assistant identifies all the steps you should take to ensure the results of your analysis are accurate and trustworthy.Step by Step GuidanceAn interactive decision tree leads you to the right statistical tool by posing a series of questions you need to answer, such as the type of data you're working with and the objective of your analysis. When you face a question you can't answer, the assistant provides the information you need to respond correctly, such as the definitions of important terms and illustrated examples that help you understand how the question relates to your own data.Dialogs helps you running analysis quick and easyThe assistant's dialogs are simple to complete. Steps have been streamlined and the text that accompanies the input fields is accessible and direct. Fields will even dynamically change based on your input.Interpret your results with confidenceSummary reports help you draw the correct conclusions and explain why. They illustrate the answers to important questions, and include comments that give your analysis context and meaning.Diagnostic reportDiagnostic reports help you further understand your analysis by providing additional detail, such as outliers you should explore and the chance of detecting a significant difference.Report cardReport cards verify your analysis by providing assumption checks and identifying any concerns you should be aware of, such as unusual data points and issues with normality and sample size.Start using the software immediately!Minitab's interface is intuitive and easy to use.An extensive selection of statistical methodsBasic statisticsAccess a complete set of statistical tools, including descriptive statistics, hypothesis tests, confidence Intervals and normality tests.Regression and ANOVAUncover the relationships between variables and identify important factors affecting the quality of your products and services.Quality toolsDetermine if your measurement systems are adequate, assess how well your processes meet specification limits, create sampling plans, and more.Design of Experiments (DoE)Find the settings that optimize your processes using factorial, response surface, mixture and Taguchi designs.Control chartsMonitor your processes over time and evaluate their stability.Reliability and survivalDetermine a product's lifetime characteristics using a wide range of tools including distribution analysis and accelerated life testing.Dig Deeper into your DataMinitab graphs are powerful tools for investigating your process further and removing any doubt about the steps you should take to improve it.Automatically update your graphs and control charts when you add or edit data.Select and examine points of interest, then use them to create alternate data sets and graphs.Share your ResultsSharing your findings with colleagues is easy. Minitab's assistant automatically produces a comprehensive, straightforward summary of your analysis that includes relevant graphs and output, and how to interpret them. And there is more, Minitab's rich graphs are the building blocks of an engaging and professional presentation. They are simple to edit, and you can export them directly to MS Word and PowerPoint. Further InformationMinitab Homepage

Price on request
Tip
Design-Expert
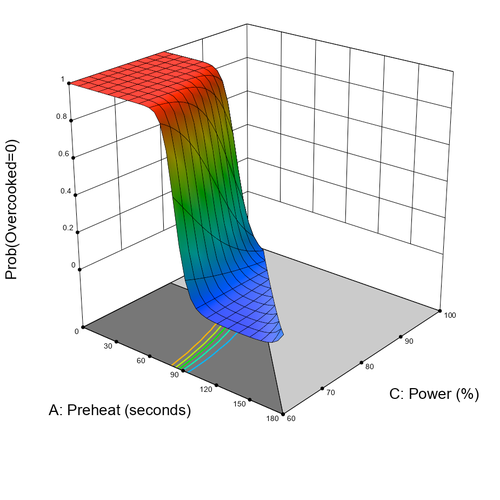
Design-Expert® – The User-Friendly Software for Design of Experiments (DOE) Design-Expert is a powerful design of experiments (DOE) software that combines an easy-to-use, intuitive interface with the latest techniques in multifactorial data analysis. The software guides you through all classic DOE phases: screening, optimization (RSM), and validation. With Design-Expert, you save time and costs in product development while improving process conditions. Why Choose Design-Expert? ✅ Interactive 3D visualizations & contour plots – Quickly and easily identify optimization potential ✅ Versatile experimental designs – From classic designs to split-plot and mixture designs ✅ Multivariate optimization – Optimize multiple response variables simultaneously ✅ Excel export – Objective functions can be exported directly as formulas ✅ Propagation of error analysis – Find robust settings for your processes Features of Design-Expert 📊 Rotatable 3D surface plots – Perfect for visualizing response surfaces 📊 Interactive contour & ternary plots – For precise process and formulation optimization 📊 All classic design types – Including D-optimal screening designs and I-optimal designs for RSM 📊 Definitive screening & split-plot designs – Ideal for hard-to-change factors 📊 Mixture & combined designs – Perfect for chemistry, pharmaceuticals, and formulation development 📊 Optimization platform with numerical optimization – Automatically calculates the best factor settings Perfect for: ✔️ Research & Development ✔️ Chemical and pharmaceutical applications ✔️ Process optimization & quality control ✔️ Formulation & recipe development Download Design-Expert® – Free Demo! Try Design-Expert, the powerful DOE software, for free! The trial version is available for download on the Stat-Ease website. 🔹 Test all features – Experience the full power of screening, optimization (RSM), and validation 🔹 Intuitive user interface – Simple operation for fast results 🔹 Optimize formulations & processes – Ideal for research, development, and quality assurance 📥 Download your free demo now: ➡ Design-Expert Trial Version

Price on request