Skip to main content Skip to search Skip to main navigation
Menu

EViews

Functionality EViews: Standard | Licensing Options Eviews: Volume License | Usage Type: Commercial
Eviews produces time series and panel analyses with outstanding quality. The most used econometrics software! ARCH models, time series, forecasts, and more.
Description

Product information "EViews"

EViews – The Leading Software for Econometrics, Time Series Analysis, and Forecasting

EViews is the top choice for financial institutions, corporations, government agencies, and academic researchers who require powerful tools for statistical analysis, time series modeling, and forecasting.

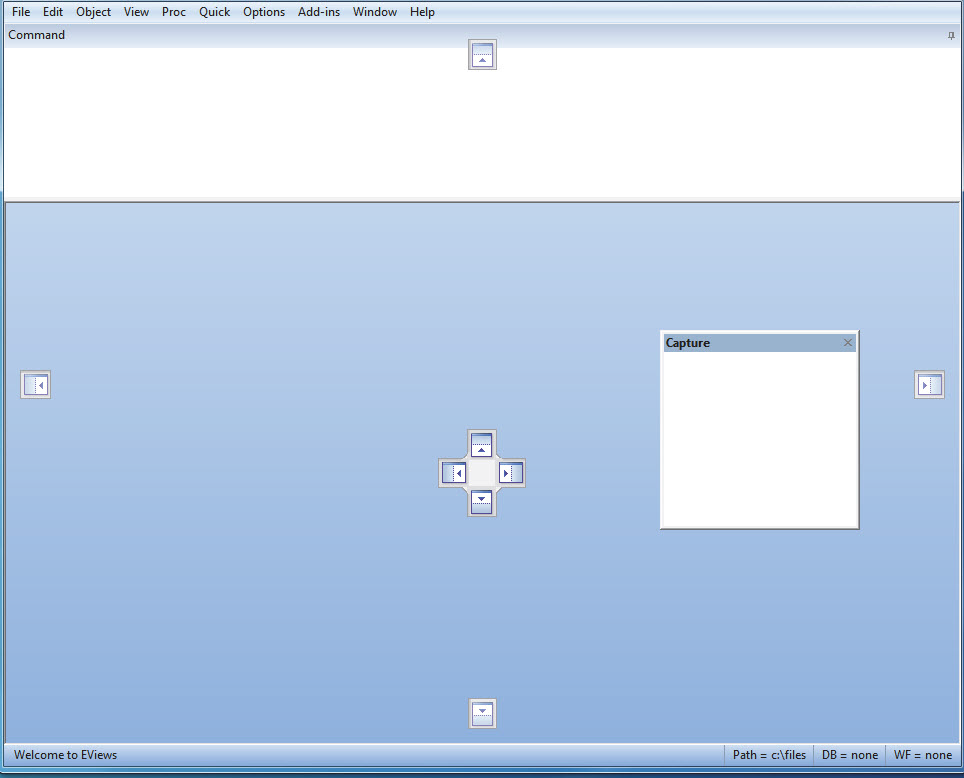
🔹 Intuitive, object-oriented interface – Easy to use for fast and efficient analysis
🔹 Powerful statistical and modeling tools – Includes ARIMA, GARCH, GLM, Monte Carlo simulations
🔹 Efficient data management – Handle and analyze time series of varying frequencies and formats
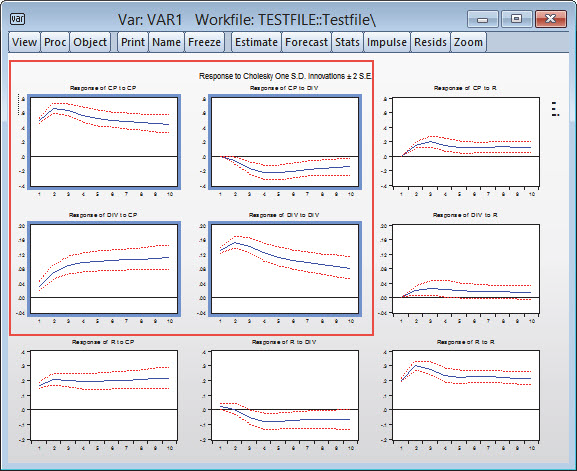
🔹 Publication-ready output – High-quality charts and tables for professional presentations and reports

📊 Harness the power of the leading econometrics software for precise analysis and reliable forecasting!


EViews – Now More Powerful and User-Friendly Than Ever

The latest version of EViews introduces advanced statistical methods, enhanced data analysis capabilities, and an improved user interface. It's the ideal tool for economists, financial analysts, and researchers working with time series, panel data, and forecasting models.


🆕 Top New Features in EViews

✔ Advanced ARDL and NARDL estimation
✔ Improved PMG and VEC models
✔ New Difference-in-Differences estimation
Bayesian Time-Varying Coefficient VARs
Panel cluster standard errors for robust inference
✔ Integration with Jupyter Notebook for Python users
✔ Enhanced graphics, tables, and Excel export
✔ Interfaces with R, MATLAB, World Bank, Eurostat, and more


📊 EViews remains the #1 choice for econometrics, statistics, and data analysis!

Learn more: Contact

Details

EViews – Leading Forecasting and Econometrics Software

EViews is a powerful and intuitive software solution for econometrics, time series analysis, and forecasting. Designed for researchers, companies, government agencies, and students, EViews combines advanced statistical and modeling tools with a user-friendly, object-oriented interface. It’s the ideal tool for working with time series, cross-sectional, or panel data.

With EViews, you can easily process large datasets, perform econometric and statistical analyses, generate forecasts or simulations, and create publication-quality charts and tables—all with just a few clicks and without writing complex code.


🔍 Why Use EViews?

  • ✅ Powerful econometric analysis tools: ARIMA, GARCH, GLM, Monte Carlo simulations & more

  • ✅ Clean, object-oriented GUI – no coding required

  • ✅ Fast and efficient data handling for large time series

  • ✅ High-quality visualizations: line charts, bar graphs, pie charts, scatter plots, and more

  • ✅ Ideal for economic research, financial modeling, and academic analysis

  • ✅ Direct data export to Excel or integration with external applications

  • ✅ Seamless workflow for modeling, forecasting, and report generation


🧩 EViews Editions: Standard vs. Enterprise

EViews is available in two editions: Standard and Enterprise.

Enterprise Edition Advantages:

  • ODBC Support – Connect directly to large external databases such as Oracle, SQL Server, IBM DB2, Sybase

  • Custom Database Interfaces – Use EDX (Database Extension Interface) and EDO (EViews Database Object) for proprietary data sources

  • Live Third-Party Data Integration – Import real-time data from Bloomberg, IHS Economics, FactSet, and more

  • Enhanced Big Data Capabilities – Handle and analyze large datasets effortlessly


📊 Advanced Graphing & Visualization in EViews

EViews includes a wide variety of visualization tools designed especially for time series analysis:

  • 📈 Line graphs, bar charts, pie charts, scatter plots, box plots

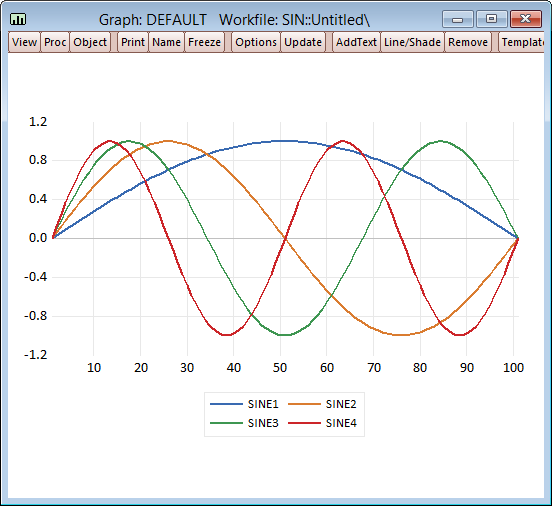
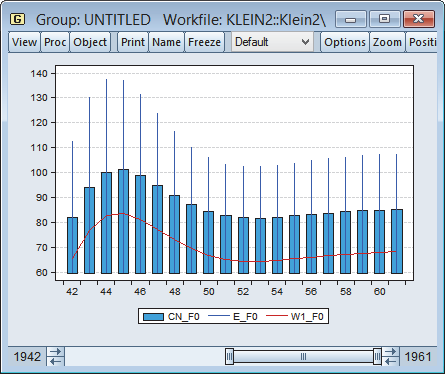
  • 🔄 Mixed graph types – Combine multiple styles into one plot

  • 🗂️ Multi-graph slideshow with zoom – Navigate and compare multiple graphs seamlessly

  • 🖱️ Fully interactive chart editing – Customize colors, lines, axes, legends, and annotations

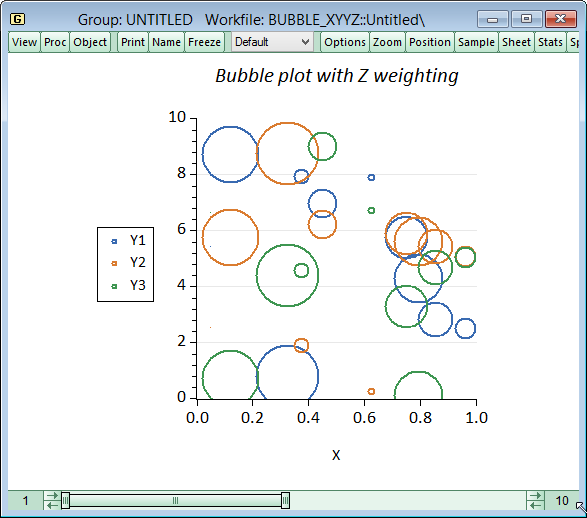
  • 🧩 Bubble plots – Add a third dimension to scatter plots via data point size

  • 🎯 Export-ready graphics – Perfect for academic papers, presentations, and reports


🔬 Key Analytical Features in EViews

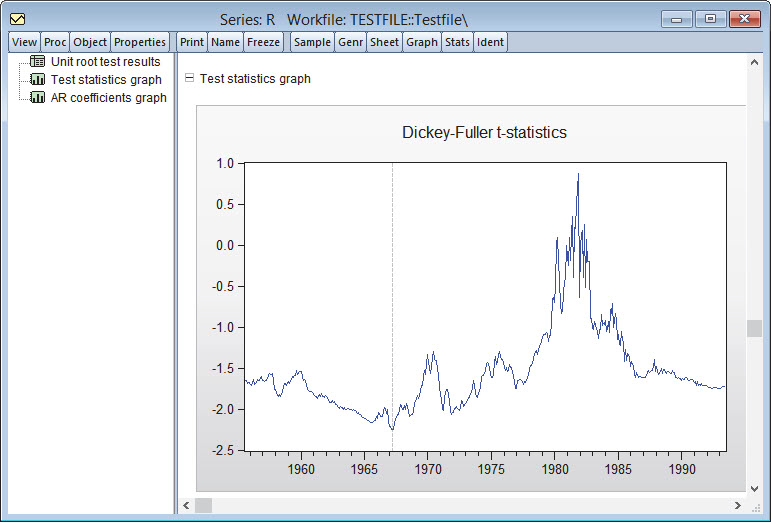
  • 🔹 Dickey-Fuller Unit Root Test (with enhancements)

  • 🔹 Mixed Graph Types – Flexible visualization of multiple variables

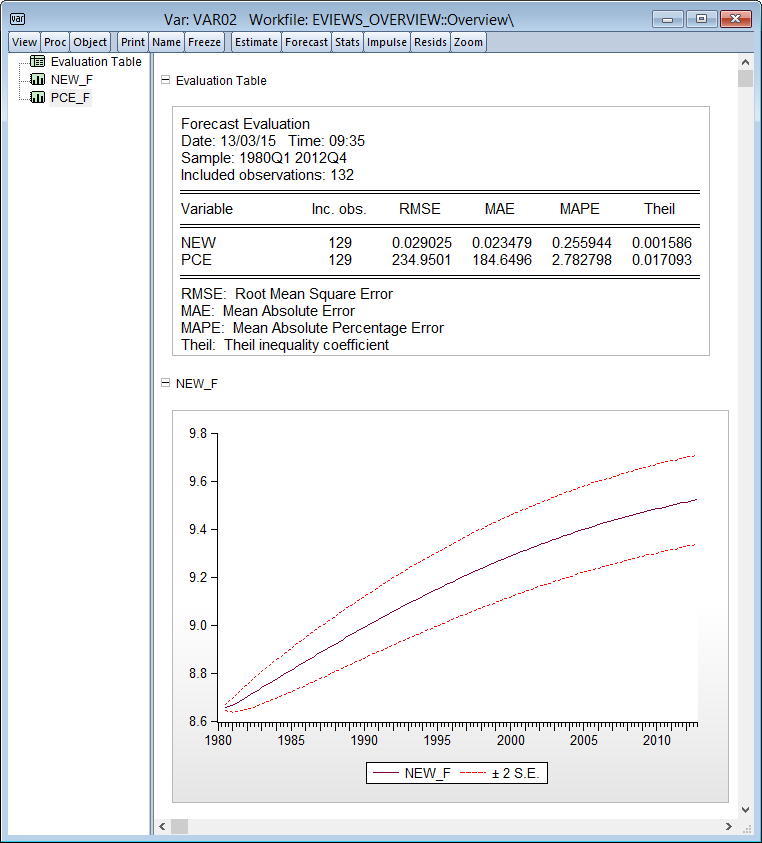
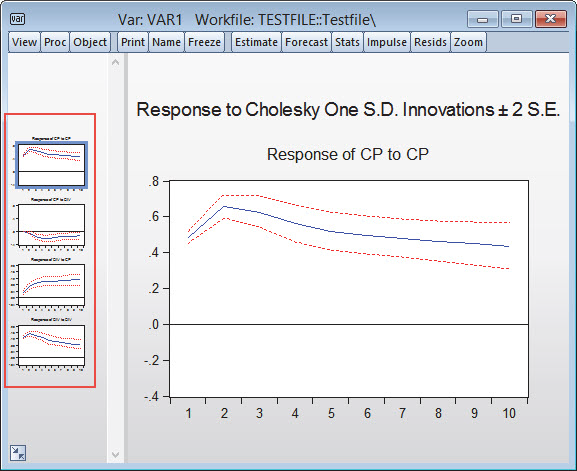
  • 🔹 One-click forecasting directly from VAR models

  • 🔹 Panel data analysis with cluster-robust standard errors

  • 🔹 Bayesian time-varying coefficient VARs

  • 🔹 New default graph templates with modern styling (white background, grid lines, thicker lines)

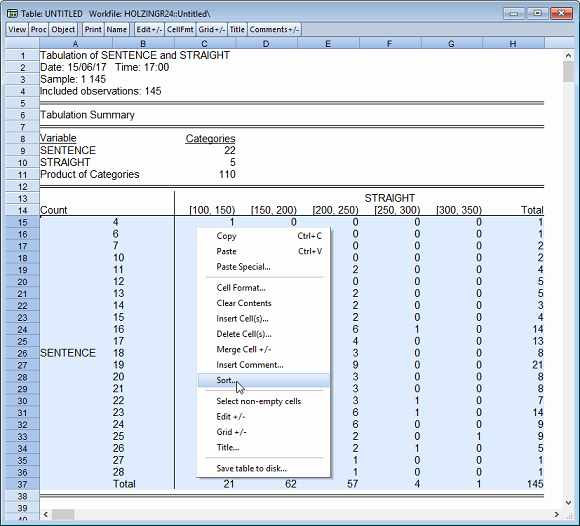
  • 🔹 Sortable tables by single or multiple columns

  • 🔹 Dynamic model simulation and scenario testing


🌐 IHS Global Link Model Integration

Gain access to the largest macroeconomic forecasting model available: the IHS Global Link Model. Analyze global economic trends in real time and assess their impact on:

  • Commodity prices

  • Exchange rates

  • Monetary and fiscal policy

  • Industry performance and more

Simulate custom scenarios with the IHS Economic Simulation Engine and export all results directly into EViews for further analysis. Expert support from IHS analytics professionals is available on demand.


💻 Additional Tools & Resources

Extend EViews’ functionality with a wide range of free downloadable Add-ins and library packages from the official IHS EViews website. Enhance your workflow with integrations to Python (Jupyter Notebooks), R, MATLAB, and various global databases (e.g., World Bank, Eurostat).


EViews in a nutshell

  • Econometrics software for time series analysis and forecasting

  • Ideal for academic, corporate, and institutional users

  • Forecasting without coding

  • Real-time economic data integration

  • Panel data models and simulations

  • Easy export to Excel and powerful visualizations

  • Enhanced statistical testing and diagnostics


📥 Learn more and download the latest EViews version:
➡ Contact

Requirements
Komponente Anforderung
CPU Pentium oder besser
Betriebssystem
  • Windows 11 (64bit)
  • Windows 10 (64bit)
  • Windows 8.1 (64bit)
  • Windows 8 (64bit)
  • Windows Server 2012 (64bit)*
  • Windows Server 2008 (64bit)*
* .NET 4.0 wird benötigt für die Verbindung zu bestimmten externen Datenbanken und die Installation des EViews-Excel Add-ins.
Arbeitsspeicher 512 MB
Festplattenspeicher 400 MB freier Speicherplatz für EViews, unterstützende Dateien, vollständige Dokumentation und Beispieldateien
Skip product gallery

Econometrics

EViews - Scripting
Course: Introduction to Programming with EViewsThe learning process begins importing data and progresses to replacing menu commands with programs. Along the way, learners are introduced to the classic elements of a programming language, such as loops and techniques for working with vectors and matrices. You will learn how to utilize the programming language in EViews for conducting data analysis, building models, and making forecasts. This course is ideal for anyone looking to deepen their skills in data handling and econometric analysis with EViews. Course Content: 📊 Getting to Know the EViews Programming Environment – Introduction to the software and programming language 📊 Creating EViews Scripts – Automating data analysis and models 📊 Data Imports and Exports – Working with external datasets and integrating results 📊 Loops and Conditions – Using loops and conditional statements in programming 📊 Error Handling – Tips for error analysis and troubleshooting in programs 📊 Macros and Functions – Creating and using custom functions and macros for modeling 📊 Programming Forecast Models – Building time series and econometric forecast models Requirements: 📌 Basic knowledge of statistics and econometrics 📌 No prior programming knowledge required; this course is designed for beginners in EViews programming 🕒 Course Duration: 2 days 🔹 Sign up now and expand your programming skills in EViews!

Price on request
EViews - Complex Models
Course: Advanced Time Series Analysis with EViews In this two-day course, you will learn advanced models for time series modeling and their application in econometrics. You will be equipped to understand and apply dynamic models, simultaneous equation models, as well as finance-specific models like ARCH and GARCH. Course Content: 📊 Review of Time Series Analysis – Basic models and techniques of time series analysis in econometrics 📊 AR, MA, ARMA, and ARIMA Models – Construction and application of classical time series models 📊 ARDL Models – Dynamic regression models and their use for analyzing long-term relationships 📊 Simultaneous Equation Models – Representation of interactions between multiple variables in a model 📊 VAR (Vector Autoregressive) and VEC (Vector Error Correction) Models – Multivariate time series analysis to model complex economic relationships 📊 ARCH and GARCH Models – Models for analyzing volatility and time dependence in financial markets Requirements: 📌 Basic knowledge of statistical hypothesis testing and linear regression 📌 Knowledge of using EViews, as taught in the course “Introduction to Econometrics with EViews” 🕒 Course Duration: 2 days 🔹 Sign up now and deepen your knowledge in time series analysis with EViews!

Price on request
Stata
🧮 Stata – The Powerful Statistical Software for Precise Data Analysis Stata is a versatile and robust software solution renowned for its exceptional capabilities in time-based data analysis. With Stata, you can model everything from simple time series (e.g., ARIMA) to complex multivariate models such as VAR and VEC. It also supports GARCH models for volatility analysis and Kaplan-Meier estimators for survival analysis. For deep panel data insights, Stata offers powerful tools for mixed-effects modeling. One of Stata's greatest strengths lies in its intuitive yet powerful programming language, which allows you to automate workflows and create custom statistical procedures with ease. 📊 Comprehensive Statistical Methods for Every Application Stata covers the full range of classical statistical techniques—and much more. You can calculate descriptive statistics, run hypothesis tests (e.g., mean comparisons, normality tests—both parametric and non-parametric), and visualize your results in high-quality scientific graphs. As a complete statistical package, Stata is ideal for research and development across disciplines. Researchers in sociology, economics, political science, epidemiology, and medical sciences especially benefit from Stata’s broad and high-quality suite of analytical tools. 🚀 Why Choose Stata? ✅ Optimized for research & development – Designed for complex data analysis and statistical evaluation ✅ Extensive features – A wide array of statistical and graphical capabilities, including publication-ready charts ✅ Flexibility – Exceptional for analyzing time-series data, volatility, and panel data ✅ Powerful yet user-friendly – Stata’s integrated programming language enables efficient automation of complex workflows 🎯 Stata Editions to Meet Your Needs Whether you're a student or a senior researcher, Stata has a version tailored to your work: Stata/BE (Basic Edition) Stata/SE (Standard Edition) Stata/MP (Multiprocessor Edition) Choose the edition that fits your dataset size and analysis complexity. 🏥 Stata for Clinical Research and Medical Statistics Stata is also a top-tier solution for clinical research and medical studies. It offers specialized tools for method validation, biostatistics, and regulatory-compliant data analysis, making it the ideal platform for precise, reliable, and reproducible results in clinical environments. 📈 Conclusion: Stata empowers researchers and analysts with the tools to handle complex data and gain deeper insights—efficiently, accurately, and intuitively. 📥 Learn more or try Stata today on the official Stata website.

Price on request