NCSS/PASS Bundle prices
0


Total
incl. 19 % VAT

NCSS PASS is one of the leading software tools for the design of medical trials and pharmaceutical or medical research in general. PASS provides the right methods for the power analysis of over 650 different statistical tests, confidence intervals and research scenarios.

Fast import of historical data – even in foreign data formats – and the simple interface help you focusing on the real problem: determining just the right sample size for your study.

Getting the right sample size involves just three steps:

  1. Choose the right study design from the navigator
  2. Enter the required parameters (typically: noise/standard deviation, relevant effect)
  3. Interpretation of results (Power, sample size)

That’s how easy NCSS PASS makes power calculation. All results will be visualized by high-level scientific graphs. All graphs are highly customizable and will add an additional level of clarity to your reports.

NCSS PASS offers:

  • Calculation of sample size and power
  • Validated procedures
  • Easy to learn, easy to use
  • Professional graphics
  • Helpful documentation as part of the output
  • Easy export to all commonly used text editors

Recommended products

NCSS

NCSS

NCSS

NCSS is a comprehensive statistics software for all kinds of applications! It’s used in medical, economic and... more details

Download pricelist Product information

PASS

PASS

PASS

NCSS PASS gives you the right sample size for your clinical trial! more details

Download pricelist Product information

NCSS and PASS - bundled Power for your Success!

PASS has been fine-tuned for over 20 years, and has become the leading sample size software choice for clinical trial, pharmaceutical, and other medical research. It has also become a mainstay in all other fields where sample size calculation or evaluation is needed. PASS software performs power analysis and calculates sample sizes for over 680 statistical tests.

PASS Overview

PASS is a standalone system
Although it is integrated with NCSS, you do not have to own NCSS to run it. You can use it with any statistical software you want.

PASS is accurate
It has been extensively verified using books and reference articles. Proof of the accuracy of each procedure is included in the extensive documentation.

PASS comes with complete help system documentation
That contains tutorials, examples, annotated output, references, formulas, validation, and complete instructions on each procedure. All procedures are validated with published articles or books.


Sample Size in PASS
In PASS, you can estimate the sample size for a statistical test or confidence interval in a few short steps. If you need guidance during any of the steps, PASS has excellent documentation.

Obtaining a Sample Size in PASS

Choosing a Procedure in PASS

Choosing A Procedure
Finding the sample size procedure is easy using the drop-down menu, the procedure search, or the category tree.


Enter The Values
The sample size procedure tools are easy to use and have built-in help messages for every option.

Sample Size tools in PASS

Ready to Use Output
When a PASS procedure is run the results are displayed in the output window. The sample size or power curves can be clicked to be shown in a separate window for viewing or saving. Multiple output runs can be sent to the output gallery for saving or for comparing sample size analyses.


NCSS - Statistical Analysis System

Comprehensive, Easy to Use, Statistical Software running under Windows 8, Windows 7, Vista, XP (32-bit and 64-bit). NCSS software provides a complete and easy-to-use collection of hundreds of statistical and graphics tools to analyze and visualize your data. From using NCSS you will benefit in several ways:

  • Comprehensive and accurate.
  • Inexpensive
  • Includes over 150 statistical and graphical tools.
  • Easy to learn and use.
  • Fully compatible to 32-bit and 32-bit versions of Windows XP/Vista, Windows 7, 8 and Windows 10!
  • Imports/exports major spreadsheet, database, and statistical file formats.
  • Sharp, flexible graphics.
  • NCSS output is easily transferred to popular word processors and presentation software such as PowerPoint.
  • Processes large data files (over 1,000 variables and 200,000 rows)

Discover NCSS


Analysis Using NCSS
With a few easy steps you can obtain meaningful numeric results and clean, clear graphics. Use the Data window to import or enter your data. Open an NCSS procedure for your desired analysis. Select the columns and run the analysis to obtain accurate and easy-to-read numeric output and graphics.

How to run an analyse in NCSS

NCSS supports a wide selection of data formats and has excellent import, filtering and transformation methods for great datamanagement

Intuitive Data Management
NCSS readily imports all major types of data files; or you can copy-and-paste your data, or enter your data directly. NCSS has excellent filtering and transformation features for managing your data.


Choosing A Procedure
Finding the right analysis or graphics procedure is easy using the drop-down menu, the procedure search, or the category tree.

With NCSS it is easy to choose the right procedure for your analysis

Thanks to the build-in help and the easy accessable tools, NCSS is a userfriendly statistical software.

Easy Analysis Set-up
The analysis and graphics tools are easy to use and have built-in help messages for every option. Select the columns to be analyzed, choose the desired reports and plots, and click Run to obtain your results.


Elegant Plot Design
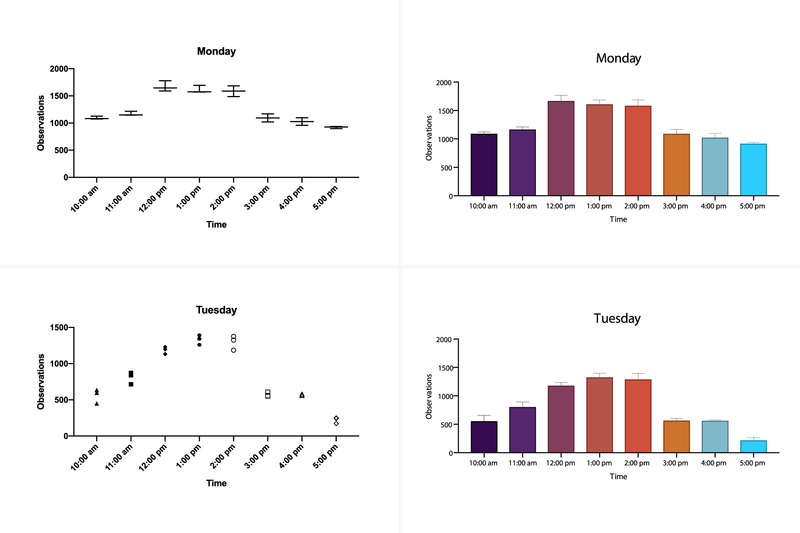
There are over 80 plots available in NCSS. Some plots are part of a general analysis procedure such as analysis of variance or regression, while other plots are standalone tools. All NCSS plots are highly customizable. Users are given control of the layout, symbols, titles, legend, axes, grid lines, and more. Plot settings are easily saved for future use or for sharing.

NCSS plots are highly customizable and elegant at the same time

NCSS provides plots, charts and outputs who are immediately ready to us for presentations

Ready-to-Use Output
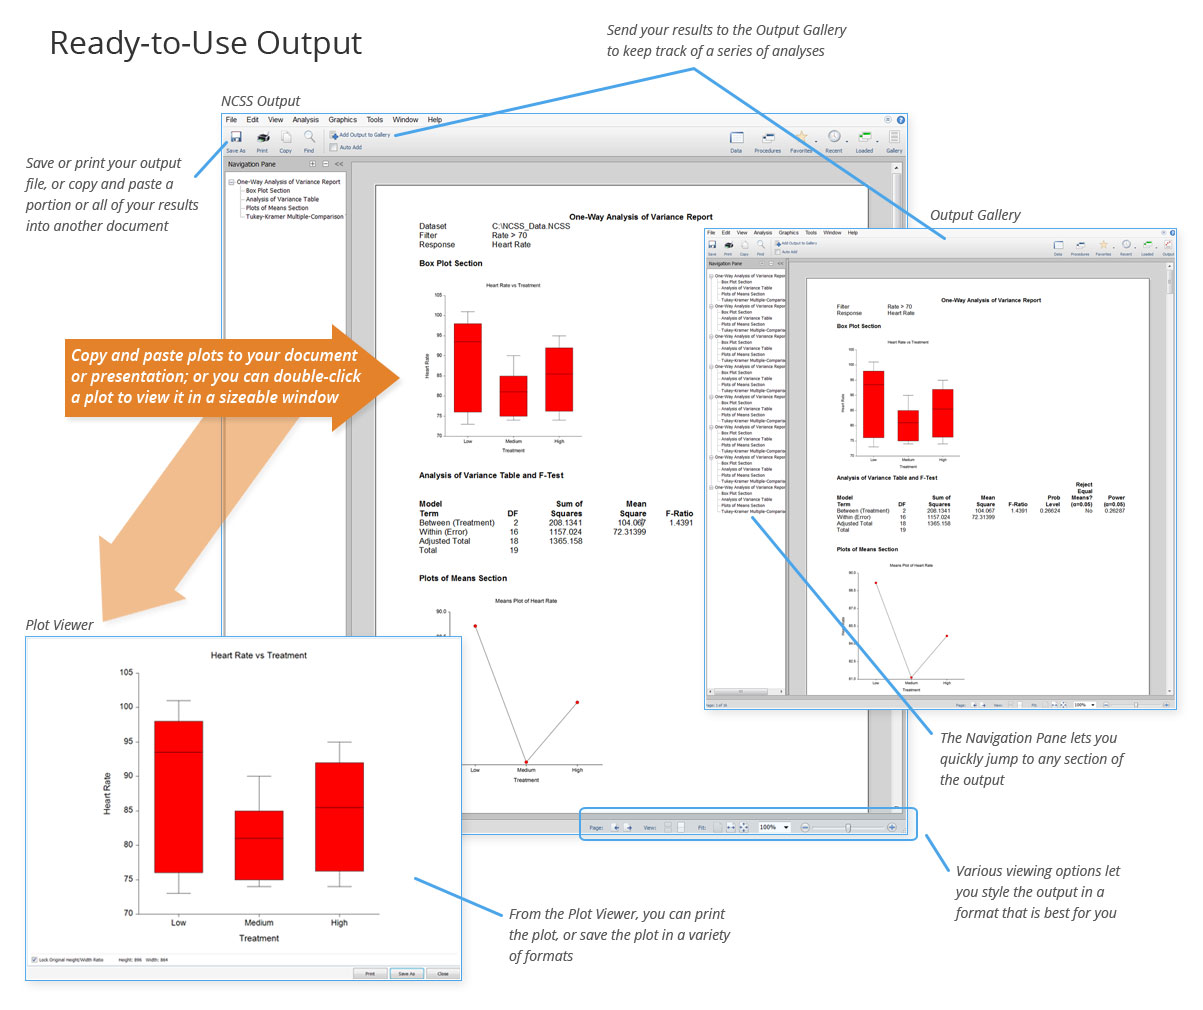
When an NCSS procedure is run, the analysis results and the desired plots are displayed in the output window. All graphics can be clicked to be shown in a separate window for viewing or saving. Navigation of the output is easy with the output navigation tree. The output and graphics are ready to be viewed, copied and pasted, or saved. Multiple output runs can be sent to the output gallery for saving or for comparing analyses.


Further Information

Minimum System Requirements for PASS

In order to run PASS,  your computer must meet the following minimum standards:

  • Processor:
    • 450 MHz or faster processor
    • 32-bit (x86) or 64-bit (x64) processor
  • RAM:
    • 256 MB (512 MB recommended)
  • Operating Systems:
    • Windows 10 or later
    • Windows 8.1
    • Windows 8
    • Windows 7
    • Windows Vista with Service Pack 2 or higher
    • Windows Server 2016 or later
    • Windows Server 2012 R2
    • Windows Server 2012
    • Windows Server 2008 SP2/R2
  • Privileges:
    • Administrative rights required during installation only
  • Third Party Software:
    • Microsoft .NET 4.6 (Comes pre-installed with Windows 10 or later and Windows Server
      2016 or later. Installation required on Windows 8.1 or earlier and Windows Server
      2012 R2 or earlier. For systems where .NET 4.6 installation is required, a .NET 4.6
      download helper will start automatically when you run the PASS setup file.
      )
    • Microsoft Windows Installer 3.1 or higher
    • Adobe Reader® 7 or higher (required for the Help System only)
  • Hard Disk Space:
    • 220 MB for PASS (plus space for Microsoft .NET 4.6 if not already installed)
  • Printer:
    • Any Windows-compatible inkjet or laser printer

Pass unter MAC OS X

Für eine Nutzung der Software auf einem MAC-Betriebssystem benötigen Sie einen Windows Emulator, wie z.B. Parallels!


Minimum System Requirements for NCSS

These are the computer requirements in order to run NCSS 12 Statistical Analysis Software:

  • Processor:
    • 450 MHz or faster processor
    • 32-bit (x86) or 64-bit (x64) processor
  • RAM:
    • 256 MB (512 MB recommended)
  • Operating Systems:
    • Windows XP with Service Pack 2 or higher
    • Windows Vista
    • Windows 7
    • Windows 8 and 8.1
    • Windows 10 or later
    • Windows Server 2003
    • Windows Server 2008
    • Windows Server 2008 R2
    • Windows Server 2012
    • Windows Server 2012 R2 or later
  • Privileges:
    • Administrative rights required during installation only
  • Third Party Software:
    • Microsoft .NET 3.5 SP1 (included with NCSS CD, comes pre-installed with Windows 7 and Windows Server 2008 R2, feature activation required on Windows 8, 8.1, 10 and Windows Server 2012 and 2012 R2)
    • Microsoft Windows Installer 3.1 or higher
    • Adobe Reader® 7 or higher (required for the Help System only)
  • Hard Disk Space:
    • 160 MB for NCSS (plus space for Microsoft .NET 3.5 SP1 if not already installed)
  • Printer:
    • Any Windows-compatible inkjet or laser printer


NCSS unter MAC OS X

Für den Betrieb von NCSS unter Mac OS X ist ein Windows Emulator, wie z.B. Parallels notwendig!


What's New in PASS 2020?


PASS adds 38 new sample size procedures and 33 updated or improved procedures. Among the new and updated procedures are those for 
 
  • Group-Sequential Tests for Hazard Rates, Means, and Proportions (Superiority and Non-Inferiority)
  • GEE Tests for Means, Proportions, and Poisson Rates in a Cluster-Randomized Design
  • Post-Marketing Surveillance for Poisson Rates
  • Tests for Means and Proportions a Split-Mouth Design
  • Confidence Intervals in Cluster and Stratified Designs
  • Tests for Means and Proportions in Cluster-Randomized Designs
  • Tests for Multiple Proportions and Poisson Rates
  • Tests for One Exponential Hazard Rate
 
  • Equivalence Tests for the Ratio of Two Means (Normal Data)
  • Updated Randomization Lists (Block Randomization and Stratified Lists)
  • Updated Conditional Power and Sample Size Re-estimation of Means, Proportions, 2×2 Cross-Over Designs, and Logrank Tests
  • Updated One-Way ANOVA
  • Updated Simplified Simulation Procedures for One Mean, Paired Means, Two Means, and Mann-Whitney Tests
  • Updated McNemar Test
  • Updated Cochran-Mantel-Haenszel Test

For the 11 new group-sequential sample size procedures in PASS , there are corresponding group-sequential analysis and sample-size re-estimation procedures in NCSS


What's New in NCSS 2020?

 
With new analysis, graphics, and data tools, NCSS 2020 is more powerful and easier to use than ever before! This new version includes
 
  • Group-Sequential Analysis for Hazard Rates, Means, and Proportions (Superiority and Non-Inferiority)
  • Simple and Stratified Dataset Random Sampling Tools
  • At-Risk Tables Added to Applicable Plots in All Survival/Reliability Procedures
  • Heatmaps Added to Factor Analysis and PCA Procedures
 
  • Tukey-Pairwise and Dunnett’s Many-to-One (Control) Multiple Comparisons Tests for Proportions Added to Contingency Tables (Crosstabs / Chi-Square Test)
  • Block Randomization and Stratified Lists Added to the Randomization Lists Procedure
  • Data Window Improvements (Now Requires up to 70% Less Memory to Load the Same Amount of Data)
  • Improved Algorithms for the Standardized Range Probability Distribution
  •  
For the 11 new group-sequential analysis procedures in NCSS, there are corresponding group-sequential power and sample-size procedures in PASS.


More Procedures NCSS

Addition of new procedures and tests:

  • Paired T-Test for Superiority by a Margin
  • One-Sample T-Test for Non-Inferiority
  • One-Sample T-Test for Superiority by a Margin
  • One-Sample T-Test for Equivalence
  • Two-Sample T-Test for Superiority by a Margin
  • Analysis of 2×2 Cross-Over Designs using T-Tests for Non-Inferiority
  • Analysis of 2×2 Cross-Over Designs using T-Tests for Superiority by a Margin
  • Analysis of 2×2 Cross-Over Designs using T-Tests for Equivalence
  • One Proportion – Non-Inferiority Tests
  • One Proportion – Superiority by a Margin Tests
  • One Proportion – Equivalence Tests
  • Two-Sample Non-Inferiority Tests for Survival Data using Cox Regression
  • Two-Sample Superiority by a Margin Tests for Survival Data using Cox Regression
  • Two-Sample Equivalence Tests for Survival Data using Cox Regression
  • Cluster Randomization – Create Cluster Means Dataset
  • Cluster Randomization – Create Cluster Proportions Dataset
  • Cluster Randomization – Create Cluster Rates Dataset
  • General Linear Models (GLM) for Fixed Factors
  • One-Way Analysis of Covariance (ANCOVA)
  • Analysis of Covariance (ANCOVA) with Two Groups
  • Clustered Heat Maps (Double Dendrograms)

Examples of new plots:

  • Clustered Heat Map (Double Dendrogram)


What’s New in PASS ?


We are pleased to announce the release of PASS. PASS  adds 55 new sample size procedures, including new procedures for the odds ratio in logistic regression, generalized estimating equation (GEE) tests, repeated measures design tests, cross-over design proportions tests, tests for two Poisson rates in cross-over designs, ordinal data tests in cross-over designs, pairwise proportion differences in a Williams cross-over design, tests for comparing two or more time-averaged differences, multiple group slope tests, mixed models tests for two means/proportions/slopes in hierarchical designs, tests for multiple correlated proportions, and more.

Installation Qualification (IQ) and Operational Qualification (OQ) tools were added in PASS.

Report section options give the user flexibility to enhance output readability.


New Procedures in PASS

Logistic Regression

  • Tests for the Odds Ratio in Logistic Regression with One Normal X (Wald Test)
  • Tests for the Odds Ratio in Logistic Regression with One Normal X and Other Xs (Wald Test)
  • Tests for the Odds Ratio in Logistic Regression with One Binary X and Other Xs (Wald Test)

Repeated Measures Slopes (GEE)

  • GEE Tests for the Slope of Two Groups in a Repeated Measures Design (Continuous Outcome)
  • GEE Tests for the Slope of Two Groups in a Repeated Measures Design (Binary Outcome)
  • GEE Tests for the Slope of Two Groups in a Repeated Measures Design (Count Outcome)
  • GEE Tests for the Slope of Multiple Groups in a Repeated Measures Design (Continuous Outcome)
  • GEE Tests for the Slope of Multiple Groups in a Repeated Measures Design (Count Outcome)

Repeated Measures Time-Averaged Differences (GEE)

  • GEE Tests for the TAD of Two Groups in a Repeated Measures Design (Continuous Outcome)
  • GEE Tests for the TAD of Two Groups in a Repeated Measures Design (Binary Outcome)
  • GEE Tests for the TAD of Two Groups in a Repeated Measures Design (Count Outcome)
  • GEE Tests for the TAD of Multiple Groups in a Repeated Measures Design (Continuous Outcome)
  • GEE Tests for the TAD of Multiple Groups in a Repeated Measures Design (Binary Outcome)
  • GEE Tests for the TAD of Multiple Groups in a Repeated Measures Design (Count Outcome)

Hierarchical Design Comparisons using Mixed Models

  • Mixed Models Tests for Two Means in a 2-Level Hierarchical Design (Level-2 Randomization)
  • Mixed Models Tests for Two Means in a 2-Level Hierarchical Design (Level-1 Randomization)
  • Mixed Models Tests for Two Proportions in a 2-Level Hierarchical Design (Level-2 Randomization)
  • Mixed Models Tests for Two Proportions in a 2-Level Hierarchical Design (Level-1 Randomization)
  • Mixed Models Tests for the Slope Difference in a 2-Level Hierarchical Design with Fixed Slopes
  • Mixed Models Tests for the Slope Difference in a 2-Level Hierarchical Design with Random Slopes
  • Mixed Models Tests for Two Means in a 3-Level Hierarchical Design (Level-3 Randomization)
  • Mixed Models Tests for Two Means in a 3-Level Hierarchical Design (Level-2 Randomization)
  • Mixed Models Tests for Two Means in a 3-Level Hierarchical Design (Level-1 Randomization)
  • Mixed Models Tests for Two Proportions in a 3-Level Hierarchical Design (Level-3 Randomization)
  • Mixed Models Tests for Two Proportions in a 3-Level Hierarchical Design (Level-2 Randomization)
  • Mixed Models Tests for Two Proportions in a 3-Level Hierarchical Design (Level-1 Randomization)
  • Mixed Models Tests for the Slope Diff. in a 3-Level Hier. Design with Fixed Slopes (Level-2 Rand.)
  • Mixed Models Tests for the Slope Diff. in a 3-Level Hier. Design with Random Slopes (Level-2 Rand.)
  • Mixed Models Tests for the Slope Diff. in a 3-Level Hier. Design with Fixed Slopes (Level-3 Rand.)
  • Mixed Models Tests for the Slope Diff. in a 3-Level Hier. Design with Random Slopes (Level-3 Rand.)

2×2 Cross-Over Design – Odds Ratio

  • Tests for the Odds Ratio of Two Proportions in a 2×2 Cross-Over Design
  • Non-Inferiority Tests for the Odds Ratio of Two Proportions in a 2×2 Cross-Over Design
  • Superiority by a Margin Tests for the Odds Ratio of Two Proportions in a 2×2 Cross-Over Design
  • Equivalence Tests for the Odds Ratio of Two Proportions in a 2×2 Cross-Over Design

2×2 Cross-Over Design – Proportion Difference

  • Tests for the Difference of Two Proportions in a 2×2 Cross-Over Design
  • Non-Inferiority Tests for the Difference of Two Proportions in a 2×2 Cross-Over Design
  • Superiority by a Margin Tests for the Difference of Two Proportions in a 2×2 Cross-Over Design
  • Equivalence Tests for the Difference of Two Proportions in a 2×2 Cross-Over Design

2×2 Cross-Over Design – Ratio of Poisson Rates

  • Tests for the Ratio of Two Poisson Rates in a 2×2 Cross-Over Design
  • Non-Inferiority Tests for the Ratio of Two Poisson Rates in a 2×2 Cross-Over Design
  • Superiority by a Margin Tests for the Ratio of Two Poisson Rates in a 2×2 Cross-Over Design
  • Equivalence Tests for the Ratio of Two Poisson Rates in a 2×2 Cross-Over Design

2×2 Cross-Over Design – Generalized Odds Ratio for Ordinal Data

  • Tests for the Generalized Odds Ratio for Ordinal Data in a 2×2 Cross-Over Design
  • Non-Inferiority Tests for the Generalized Odds Ratio for Ordinal Data in a 2×2 Cross-Over Design
  • Superiority by a Margin Tests for the Gen. Odds Ratio for Ordinal Data in a 2×2 Cross-Over Design
  • Equivalence Tests for the Generalized Odds Ratio for Ordinal Data in a 2×2 Cross-Over Design

Williams Cross-Over Design – Pairwise Proportion Differences

  • Tests for Pairwise Proportion Differences in a Williams Cross-Over Design
  • Non-Inferiority Tests for Pairwise Proportion Differences in a Williams Cross-Over Design
  • Superiority by a Margin Tests for Pairwise Proportion Differences in a Williams Cross-Over Design
  • Equivalence Tests for Pairwise Proportion Differences in a Williams Cross-Over Design

Williams Cross-Over Design – Pairwise Mean Differences

  • Tests for Pairwise Mean Differences in a Williams Cross-Over Design
  • Non-Inferiority Tests for Pairwise Mean Differences in a Williams Cross-Over Design
  • Superiority by a Margin Tests for Pairwise Mean Differences in a Williams Cross-Over Design
  • Equivalence Tests for Pairwise Mean Differences in a Williams Cross-Over Design

Multiple Correlated Proportions (McNemar-Bowker Test of Symmetry)

  • Tests for Multiple Correlated Proportions (McNemar-Bowker Test of Symmetry)


Features of the software PASS

PASS 14 adds over 25 new power and sample size procedures. Over 45 procedures were updated and/or improved.

New Procedures

Means

  • Equivalence Tests for the Difference Between Two Paired Means
  • Non-Inferiority Tests for Two Means in a Cluster-Randomized Design
  • Equivalence Tests for Two Means in a Cluster-Randomized Design
  • Superiority by a Margin Tests for Two Means in a Cluster-Randomized Design
  • Tests for the Difference of Two Means in a Higher-Order Cross-Over Design
  • Tests for the Ratio of Two Means in a Higher-Order Cross-Over Design
  • Tests for Fold Change of Two Means
  • MxM Cross-Over Designs
  • M-Period Cross-Over Designs using Contrasts
  • One-Way Repeated Measures
  • One-Way Repeated Measures Contrasts
  • One-Way Analysis of Variance Contrasts
  • Confidence Intervals for One-Way Repeated Measures Contrasts

Rates and Counts

  • Tests for the Difference Between Two Poisson Rates
  • Tests for the Difference Between Two Poisson Rates in a Cluster-Randomized Design
  • Tests for the Ratio of Two Negative Binomial Rates

Survival

  • Logrank Tests in a Cluster-Randomized Design
  • One-Sample Logrank Tests
  • One-Sample Cure Model Tests

Regression

  • Reference Intervals for Clinical and Lab Medicine
  • Tests for the Difference Between Two Linear Regression Slopes
  • Tests for the Difference Between Two Linear Regression Intercepts
  • Mendelian Randomization with a Binary Outcome
  • Mendelian Randomization with a Continuous Outcome

Acceptance Sampling

  • Acceptance Sampling for Attributes
  • Operating Characteristic Curves for Acceptance Sampling for Attributes

Verbesserte oder Veränderte Prozeduren in PASS 14

Means

  • Tests for Two Means using Ratios
  • Tests for Two Means in a Cluster-Randomized Design
  • Non-Inferiority Tests for the Difference of Two Means in a Higher-Order Cross-Over Design
  • Non-Inferiority Tests for the Ratio of Two Means in a Higher-Order Cross-Over Design
  • Equivalence Tests for the Difference of Two Means in a Higher-Order Cross-Over Design
  • Equivalence Tests for the Ratio of Two Means in a Higher-Order Cross-Over Design
  • Superiority by a Margin Tests for the Difference of Two Means in a Higher-Order Cross-Over Design
  • Superiority by a Margin Tests for the Ratio of Two Means in a Higher-Order Cross-Over Design
  • One-Way Analysis of Variance F-Tests

Rates and Counts

  • Tests for One Poisson Rate
  • Tests for the Ratio of Two Poisson Rates

Proportions

  • Tests for One Proportion
  • Non-Inferiority Tests for One Proportion
  • Equivalence Tests for One Proportion
  • Superiority by a Margin Tests for One Proportion
  • Tests for Two Proportions
  • Tests for Two Proportions in a Repeated Measures Design
  • Non-Inferiority Tests for the Difference Between Two Proportions
  • Non-Inferiority Tests for the Ratio of Two Proportions
  • Non-Inferiority Tests for the Odds Ratio of Two Proportions
  • Equivalence Tests for the Difference Between Two Proportions
  • Equivalence Tests for the Ratio of Two Proportions
  • Equivalence Tests for the Odds Ratio of Two Proportions
  • Superiority by a Margin Tests for the Difference Between Two Proportions
  • Superiority by a Margin Tests for the Ratio of Two Proportions
  • Superiority by a Margin Tests for the Odds Ratio of Two Proportions
  • Confidence Intervals for the Difference Between Two Proportions
  • Confidence Intervals for the Ratio of Two Proportions
  • Confidence Intervals for the Odds Ratio of Two Proportions
  • Tests for Two Correlated Proportions (McNemar Test)
  • Non-Inferiority Tests for the Difference Between Two Correlated Proportions
  • Non-Inferiority Tests for the Ratio of Two Correlated Proportions
  • Equivalence Tests for the Difference Between Two Correlated Proportions
  • Equivalence Tests for the Ratio of Two Correlated Proportions
  • Tests for Two Proportions in a Cluster-Randomized Design
  • Non-Inferiority Tests for the Difference of Two Proportions in a Cluster-Randomized Design
  • Non-Inferiority Tests for the Ratio of Two Proportions in a Cluster-Randomized Design
  • Equivalence Tests for the Difference of Two Proportions in a Cluster-Randomized Design
  • Equivalence Tests for the Ratio of Two Proportions in a Cluster-Randomized Design
  • Superiority by a Margin Tests for the Difference of Two Proportions in a Cluster-Randomized Design
  • Superiority by a Margin Tests for the Ratio of Two Proportions in a Cluster-Randomized Design
  • Group-Sequential Tests for Two Proportions (Simulation)
  • Group-Sequential Non-Inferiority Tests for the Difference of Two Proportions (Simulation)
  • Group-Sequential Non-Inferiority Tests for the Ratio of Two Proportions (Simulation)
  • Group-Sequential Non-Inferiority Tests for the Odds Ratio of Two Proportions (Simulation)
  • Group-Sequential Superiority by a Margin Tests for the Difference of Two Proportions (Simulation)
  • Group-Sequential Superiority by a Margin Tests for the Ratio of Two Proportions (Simulation)
  • Group-Sequential Superiority by a Margin Tests for the Odds Ratio of Two Proportions (Simulation)

Features of the software NCSS

Analysis of Variance

  • One-Way Analysis of Variance
  • Box-Cox Transformation for Two or More Groups (T-Test and One-Way ANOVA)
  • Balanced Design Analysis of Variance
  • General Linear Models (GLM)
  • Repeated Measures Analysis of Variance
  • Multivariate Analysis of Variance (MANOVA)
  • Analysis of Two-Level Designs
  • Nondetects-Data Group Comparison
  • Area Under Curve

Clustering

  • Fuzzy Clustering
  • Hierarchical Clustering / Dendrograms
  • K-Means Clustering
  • Medoid Partitioning
  • Regression Clustering

Correlation

  • Linear Regression and Correlation
  • Box-Cox Transformation for Simple Linear Regression
  • Point-Biserial and Biserial Correlations
  • Correlation Matrix
  • Canonical Correlation
  • Lin's Concordance Correlation Coefficient
  • Bland-Altman Plot and Analysis

Curve Fitting

  • Curve Fitting - General
  • Michaelis-Menten Equation
  • Ratio of Polynomials Fit - One Variable
  • Ratio of Polynomials Search - One Variable
  • Reference Intervals with a Covariate
  • Sum of Functions Models
  • Nonlinear Regression
  • Ratio of Polynomials Fit - Many Variables
  • Ratio of Polynomials Search - Many Variables
  • Function Plots
  • Scatter Plot Matrix for Curve Fitting

Descriptive Statistics

  • Descriptive Statistics
  • Descriptive Statistics - Summary Tables
  • Contingency Tables (Crosstabs / Chi-Square Test)
  • Frequency Tables
  • Box-Cox Transformation
  • Data Screening
  • Data Simulation
  • Grubbs' Outlier Test
  • Normality Tests
  • Stem-and-Leaf Plots
  • Back-to-Back Stem-and-Leaf Plots
  • Item Analysis
  • Item Response Analysis
  • Area Under Curve
  • Circular Data Analysis
  • Tolerance Intervals

Design of Experiments

  • Randomization Lists
  • Balanced Incomplete Block Designs
  • Fractional Factorial Designs
  • Latin Square Designs
  • Response Surface Designs
  • Screening Designs
  • Taguchi Designs
  • Two-Level Designs
  • Design Generator
  • D-Optimal Designs
  • Analysis of Two-Level Designs
  • Response Surface Regression

Forecasting / Time Series

  • ARIMA (Box-Jenkins)
  • Automatic ARMA
  • Theoretical ARMA
  • Autocorrelations
  • Cross-Correlations
  • Spectral Analysis
  • Decomposition Forecasting
  • Exponential Smoothing - Horizontal
  • Exponential Smoothing - Trend
  • Exponential Smoothing - Trend / Seasonal
  • Harmonic Regression
  • Analysis of Runs
  • Time Series Plots

Mass Appraisal

  • Appraisal Ratios
  • Comparables - Sales Price
  • Hybrid Appraisal Models
  • Descriptive Statistics
  • Descriptive Statistics - Summary Tables
  • Multiple Regression
  • Nonlinear Regression

Meta-Analysis

  • Meta-Analysis of Correlated Proportions
  • Meta-Analysis of Hazard Ratios
  • Meta-Analysis of Means
  • Meta-Analysis of Proportions
  • Forest Plots

Mixed Models

  • Mixed Models - General
  • Mixed Models - No Repeated Measures
  • Mixed Models - Repeated Measures
  • Mixed Models - Random Coefficients

Multivariate

  • Canonical Correlation
  • Equality of Covariance
  • Factor Analysis
  • Principal Components Analysis
  • Discriminant Analysis
  • Hotelling's One-Sample T2
  • Hotelling's Two-Sample T2
  • Multivariate Analysis of Variance (MANOVA)
  • Correspondence Analysis
  • Multidimensional Scaling

Nonparametric

  • Analysis of Runs
  • Bootstrap Confidence Intervals (One-Sample T-Test)
  • Bootstrap Confidence Intervals (Paired T-Test)
  • Bootstrap Confidence Intervals (Two-Sample T-Test)
  • Cochran's Q Test
  • Cumulative Incidence
  • Friedman's Rank Test (Balanced Design ANOVA)
  • Kaplan-Meier Curves (Logrank Tests)
  • Kolmogorov-Smirnov Test (Two-Sample T-Test)
  • Kruskal-Wallis Test (One-Way ANOVA)
  • Mann-Whitney U Test (Two-Sample T-Test)
  • Nondetects-Data Group Comparison
  • Randomization Test (One-Sample T-Test)
  • Randomization Test (Paired T-Test)
  • Randomization Test (Two-Sample T-Test)
  • ROC Curves
  • Spearman Rank Correlation (Correlation Matrix, Linear Regression and Correlation)
  • Wilcoxon Signed-Rank Test (One-Sample T-Test)
  • Wilcoxon Signed-Rank Test (Paired T-Test)

Operations Research

  • Linear Programming

Proportions

  • One Proportion
  • Two Proportions
  • Two Proportions - Non-Inferiority Tests
  • Two Proportions - Superiority Tests
  • Two Proportions - Equivalence Tests
  • Two Proportions - Two-Sided Tests vs. a Margin
  • Two Correlated Proportions (McNemar Test)
  • Two Correlated Proportions - Non-Inferiority Tests
  • Two Correlated Proportions - Superiority Tests
  • Two Correlated Proportions - Equivalence Tests
  • Contingency Tables (Crosstabs / Chi-Square Test)
  • Frequency Tables
  • Cochran's Q Test
  • Loglinear Models
  • Mantel-Haenszel Test
  • ROC Curves
  • Item Analysis
  • Item Response Analysis
  • Binary Diagnostic Tests - Single Sample
  • Binary Diagnostic Tests - Two Independent Samples
  • Binary Diagnostic Tests - Paired Samples
  • Binary Diagnostic Tests - Clustered Samples

Quality Control

  • X-bar and R Charts
  • X-bar and s Charts
  • X-bar Charts
  • R Charts
  • s Charts
  • CUSUM Charts
  • Moving Average Charts
  • EWMA Charts
  • Individuals and Moving Range Charts
  • Levey-Jennings Charts
  • P Charts
  • NP Charts
  • C Charts
  • U Charts
  • Capability Analysis
  • R & R Study
  • Tolerance Intervals
  • Lag Plots
  • Analysis of Runs
  • Pareto Charts

Regression

  • Linear Regression and Correlation
  • Box-Cox Transformation for Simple Linear Regression
  • Deming Regression
  • Harmonic Regression
  • Mixed Models - Random Coefficients
  • Point-Biserial and Biserial Correlations
  • Multiple Regression
  • Multiple Regression with Serial Correlation
  • Nondetects Data Regression
  • Principal Components Regression
  • Response Surface Regression
  • Ridge Regression
  • Robust Regression
  • Cox Regression
  • Parametric Survival (Weibull) Regression
  • Logistic Regression
  • Discriminant Analysis
  • Poisson Regression
  • Probit Analysis
  • Nonlinear Regression

Regression (Variable Selection)

  • All Possible Regressions
  • Stepwise Regression
  • Subset Selection in Multiple Regression
  • Subset Selection in Multivariate Y Multiple Regression
  • Cox Regression
  • Discriminant Analysis
  • Logistic Regression
  • Poisson Regression

Survival / Reliability

  • Cumulative Incidence
  • Kaplan-Meier Curves (Logrank Tests)
  • Life-Table Analysis
  • Cox Regression
  • Parametric Survival (Weibull) Regression
  • Beta Distribution Fitting
  • Distribution (Weibull) Fitting
  • Gamma Distribution Fitting
  • Mantel-Haenszel Test
  • Probit Analysis
  • Time Calculator
  • Tolerance Intervals
  • Survival Parameter Conversion Tool
  • Survival Plots

T-Tests

  • One-Sample T-Test
  • Paired T-Test
  • Paired T-Test for Non-Inferiority
  • Paired T-Test for Equivalence
  • Two-Sample T-Test
  • Two-Sample T-Test from Means and SD's
  • Box-Cox Transformation for Two or More Groups (T-Test and One-Way ANOVA)
  • Testing Non-Inferiority with Two Independent Samples
  • Testing Equivalence with Two Independent Samples
  • Bland-Altman Plot and Analysis
  • Hotelling's One-Sample T2
  • Hotelling's Two-Sample T2
  • Analysis of Two-Level Designs
  • Cross-Over Analysis Using T-Tests

Graphics Procedures

Bar Charts

  • Bar Charts
  • Bar Charts (2 Factors)
  • 3D Bar Charts
  • 3D Bar Charts (2 Factors)
  • Pareto Charts

Bland-Altman Plot

  • Bland-Altman Plot and Analysis

Box Plots

  • Box Plots
  • Box Plots (2 Factors)

Circular Data Plots

  • Circular Data Analysis (Rose Plots)
  • Pie Charts

Combo Charts

  • Combo Charts
  • Combo Charts (2 Factors)

Contour Plots

  • Contour Plots

Curve Fitting

  • Curve Fitting - General
  • Michaelis-Menten Equation
  • Function Plots
  • Scatter Plot Matrix for Curve Fitting

Dendrograms

  • Hierarchical Clustering (Dendrograms)

Density Plots

  • Density Plots
  • Density Plots (2 Factors)

Dot Plots

  • Dot Plots
  • Dot Plots (2 Factors)

Error-Bar Charts

  • Error-Bar Charts
  • Error-Bar Charts (2 Factors)

Forecasting / Time Series

  • ARIMA (Box-Jenkins)
  • Automatic ARMA
  • Theoretical ARMA
  • Autocorrelations
  • Cross-Correlations
  • Spectral Analysis
  • Decomposition Forecasting
  • Exponential Smoothing - Horizontal
  • Exponential Smoothing - Trend
  • Exponential Smoothing - Trend / Seasonal
  • Lag Plots
  • Analysis of Runs

Forest Plots

  • Meta-Analysis of Correlated Proportions
  • Meta-Analysis of Hazard Ratios
  • Meta-Analysis of Means
  • Meta-Analysis of Proportions

Function Plots

  • Function Plots

Histograms

  • Histograms
  • Comparative Histograms
  • Comparative Histograms (2 Factors)
  • Rose Plots

Kaplan-Meier Curves (Survival)

  • Kaplan-Meier Curves

Line Charts

  • Line Charts
  • Line Charts (2 Factors)
  • 3D Line Charts
  • 3D Line Charts (2 Factors)

Mosaic Plots

  • Mosaic Plots

Percentile Plots

  • Percentile Plots
  • Percentile Plots (2 Factors)

Pie Charts

  • Pie Charts

Probability Plots

  • Normal Probability Plots
  • Weibull Probability Plots
  • Log-Normal Probability Plots
  • Gamma Probability Plots
  • Exponential Probability Plots
  • Chi-Square Probability Plots
  • Uniform Probability Plots
  • Half-Normal Probability Plots
  • Probability Plot Comparison

Quality Control Charts

  • X-bar and R Charts
  • X-bar and s Charts
  • X-bar Charts
  • R Charts
  • s Charts
  • CUSUM Charts
  • Moving Average Charts
  • EWMA Charts
  • Individuals and Moving Range Charts
  • Levey-Jennings Charts
  • P Charts
  • NP Charts
  • C Charts
  • U Charts
  • Capability Analysis
  • Lag Plots
  • Analysis of Runs
  • Pareto Charts

ROC Curves

  • ROC Curves

Scatter Plots

  • Scatter Plots
  • 3D Scatter Plots
  • Scatter Plot Matrix
  • Scatter Plot Matrix for Curve Fitting
  • Lag Plots

Stem-and-Leaf Plots

  • Stem-and-Leaf Plots
  • Back-to-Back Stem-and-Leaf Plots

Surface and Contour Plots

  • Contour Plots
  • 3D Surface Plots

3D

  • 3D Scatter Plots
  • 3D Surface Plots
  • 3D Bar Charts
  • 3D Bar Charts (2 Factors)
  • 3D Line Charts
  • 3D Line Charts (2 Factors)

Operations

  • Data Window
  • Importing Data
  • Exporting Data
  • Filters
  • Transformations
  • Stacking Data
  • Unstacking Data
  • Creating Contrast Variables

Procedures

  • Box-Cox Transformation
  • Box-Cox Transformation for Two or More Groups (T-Test and One-Way ANOVA)
  • Box-Cox Transformation for Simple Linear Regression
  • Data List
  • Data Screening
  • Data Simulation
  • Merging Two Datasets
  • Data Matching - Greedy
  • Data Matching - Optimal
  • Data Stratification
  • Time Calculator

Calculators

  • Probability Calculator
  • Chi-Square Effect Size Calculator
  • Odds Ratio and Proportions Calculator
  • Standard Deviation Calculator
  • Survival Parameter Conversion Tool

New Features in NCSS

New Procedures and Tests

  • Conditional Logistic Regression
  • Multiple Regression – Basic
  • Negative Binomial Regression
  • Zero-Inflated Negative Binomial Regression
  • Zero-Inflated Poisson Regression
  • Geometric Regression
  • Fractional Polynomial Regression
  • Passing-Bablok Regression for Method Comparison
  • Robust Linear Regression (Passing-Bablok Median-Slope)
  • Logistic Regression (including confidence intervals for AUC)
  • Two-Stage Least Squares
  • Scatter Plots with Error Bars
  • Scatter Plots with Error Bars from Summary Data
  • Error-Bar Charts from Summary Data
  • Error-Bar Charts from Summary Data (2 Factors)
  • Descriptive Statistics – Summary Tables
  • Descriptive Statistics – Summary Lists
  • One ROC Curve and Cutoff Analysis
  • Comparing Two ROC Curves – Independent Groups Design
  • Comparing Two ROC Curves – Paired Design
  • Single Sample Binary Diagnostic Test Analysis
  • Correlation
  • Circular Data Correlation
  • Reference Intervals
  • Appraisal Ratio Studies
  • Comparables Appraisal
  • Hybrid Appraisal Models
  • Multiple Regression for Appraisal
  • Acceptance Sampling for Attributes
  • Operating Characteristic Curves for Acceptance Sampling for Attributes
  • Linear Programming with Bounds
  • Mixed Integer Programming
  • Quadratic Programming
  • Transportation
  • Assignment
  • Minimum Spanning Tree
  • Shortest Route
  • Maximum Flow
  • Minimum Cost Capacitated Flow
  • Transshipment
  • Dwass-Steel-Critchlow-Fligner MC Test (in the One-Way Analysis of Variance Procedure)

Enhancements

  • Data Simulation Procedure
    The Data Simulation procedure was enhanced to include a much larger selection of distributions.
  • One-Way ANOVA Residuals
    The One-Way Analysis of Variance procedure now gives the ability to store residuals.
  • Contingency Tables Table Entry
    The table entry in the Contingency Tables (Crosstabs / Chi-Square Test) procedure was improved.
  • One Proportion Data Entry
    A Database Data Entry option is now available in the One Proportion procedure.
  • Export Tool
    The Export tool now has the ability to select variables for export.
  • Output Titles
    Software version titles are given in the output.
  • Error-Bar Plots
    The error-bar plots procedures now give the options for Confidence Interval and Range.
  • Spreadsheet Controls
    The Spreadsheet controls have been updated.
  • 3D Charting
    The 3D charting control has been updated for additional processing and display speed.
  • Column Selection Tools
    The column selection tools have been dramatically enhanced.
  • Auto-Scaling of Ticks
    The Auto-Scaling of the ticks of the numeric axis of plots has been improved.
  • Filters and Missing Values in Time Series and Forecasting
    Filter and missing values options are now available in all Forecasting and Time Series procedures.
  • Procedure Menus
    The procedure menus were enhanced to be more intuitive.