Minitab is a powerful statistical software for statistical analysis of data e.g. in research and quality management. Using an interactive wizard, the program offers a comprehensive range of statistical methods and graphical tools allowing to perform safely and successfully the steps of an analysis. Therefore, it is useful for industry, research, development and teaching.
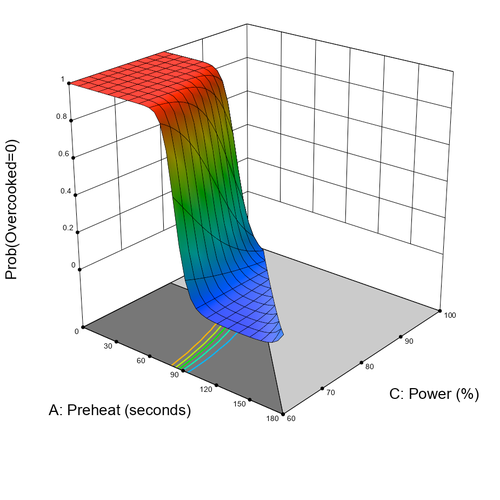
The system environment facilitates the steps from data import to 2D and 3D data visualization up to data exploration and analytical statistics. The project management, reporting and documentation of the results are logical and flexible to handle.
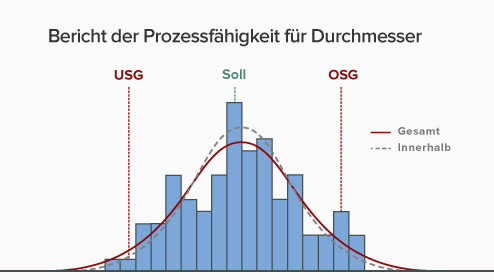
Minitab is used worldwide for the implementation of Six Sigma projects and provides standard statistical methods, ANOVA, regression, quality tools, quality control charts, life cycle and reliability analysis, measurement system analysis, process capability analysis, design of experiments (DoE), excellent graphs and much more.
Minitab shows an extreme adaptability, supported both by the integrated programming language allowing to automate processes and by the option to compile menus individually. Thus, it is not only possible to define company-wide standards, but also to adapt Minitab to the company's needs, giving the users only those analysis at hand which is actually needed.
Arguments for Minitab:
- Minitab offers a comprehensive range of statistical methods and graphical tools
- Minitab supports you in all phases of a Sig Sigma process
- Minitab is very adaptable and programmable
Minitab - The 'All-In-One' Statistical and Graphical Analysis Software Package
Minitab is one of the leading providers of statistical software and services for quality management, education and research.
Minitab provides precise but easy to use functions for quality management and general statistics. Minitab is used by plenty of leading companies like General Electric, Ford Motor Company, General Motors, 3M, Honeywell International, LG, Toshiba, Nokia and many leading Six Sigma consultants.
As an introduction to statistics, Minitab is also established in more than 4.000 technical schools and universities. Minitab's head office is located in State College, PA, USA and has branch offices in the UK, France and business partners across the whole world.
Interactive Assistant for smooth Analysis
Minitab gives you the confidence you need to improve quality, with features like an interactive assistant that guides you through your analysis. It is specifically designed to help you succeed at every step of your analysis. Once you've chosen the right tool, the assistant identifies all the steps you should take to ensure the results of your analysis are accurate and trustworthy.
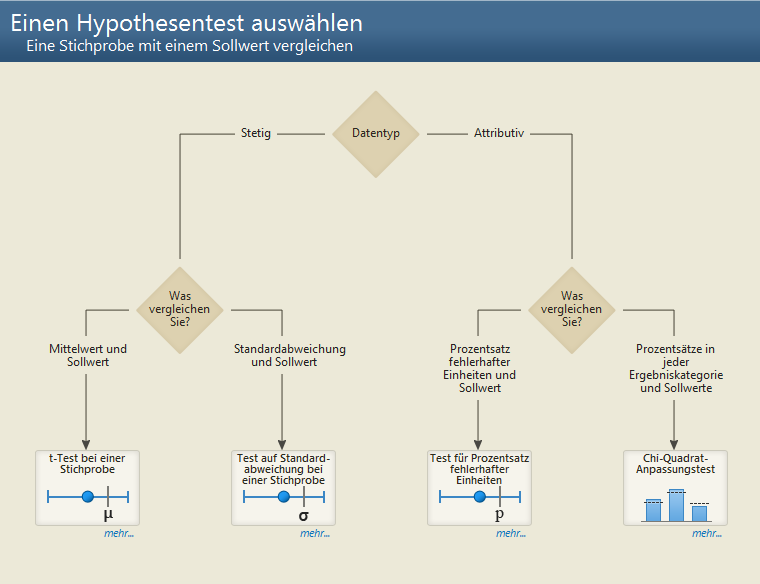 Step by Step Guidance
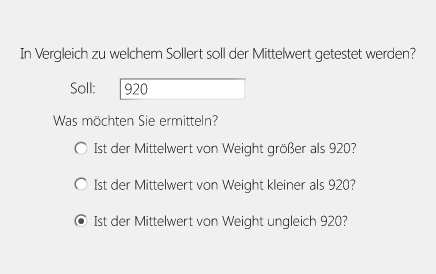
An interactive decision tree leads you to the right statistical tool by posing a series of questions you need to answer, such as the type of data you're working with and the objective of your analysis. When you face a question you can't answer, the assistant provides the information you need to respond correctly, such as the definitions of important terms and illustrated examples that help you understand how the question relates to your own data.
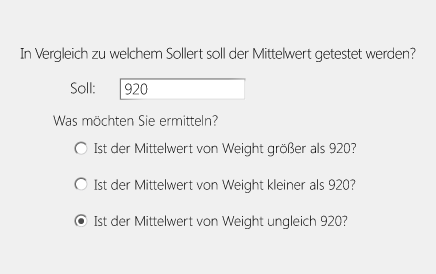 Dialogs helps you running analysis quick and easy
The assistant's dialogs are simple to complete. Steps have been streamlined and the text that accompanies the input fields is accessible and direct. Fields will even dynamically change based on your input.
Interpret your results with confidence
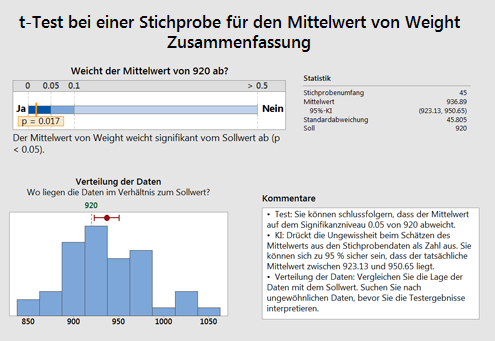
Summary reports help you draw the correct conclusions and explain why. They illustrate the answers to important questions, and include comments that give your analysis context and meaning. | Diagnostic report
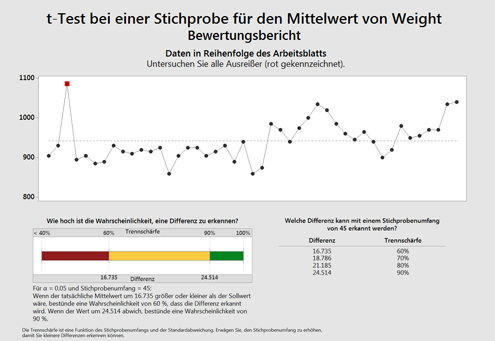
Diagnostic reports help you further understand your analysis by providing additional detail, such as outliers you should explore and the chance of detecting a significant difference. | Report card
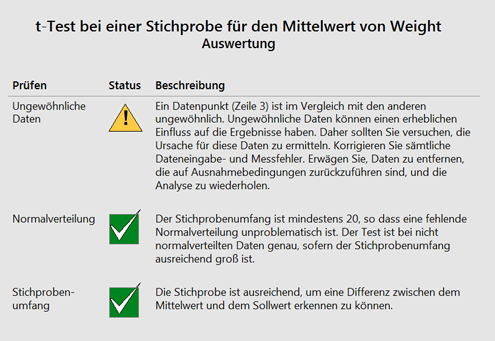
Report cards verify your analysis by providing assumption checks and identifying any concerns you should be aware of, such as unusual data points and issues with normality and sample size. |
 |  |  |
Start using the software immediately!
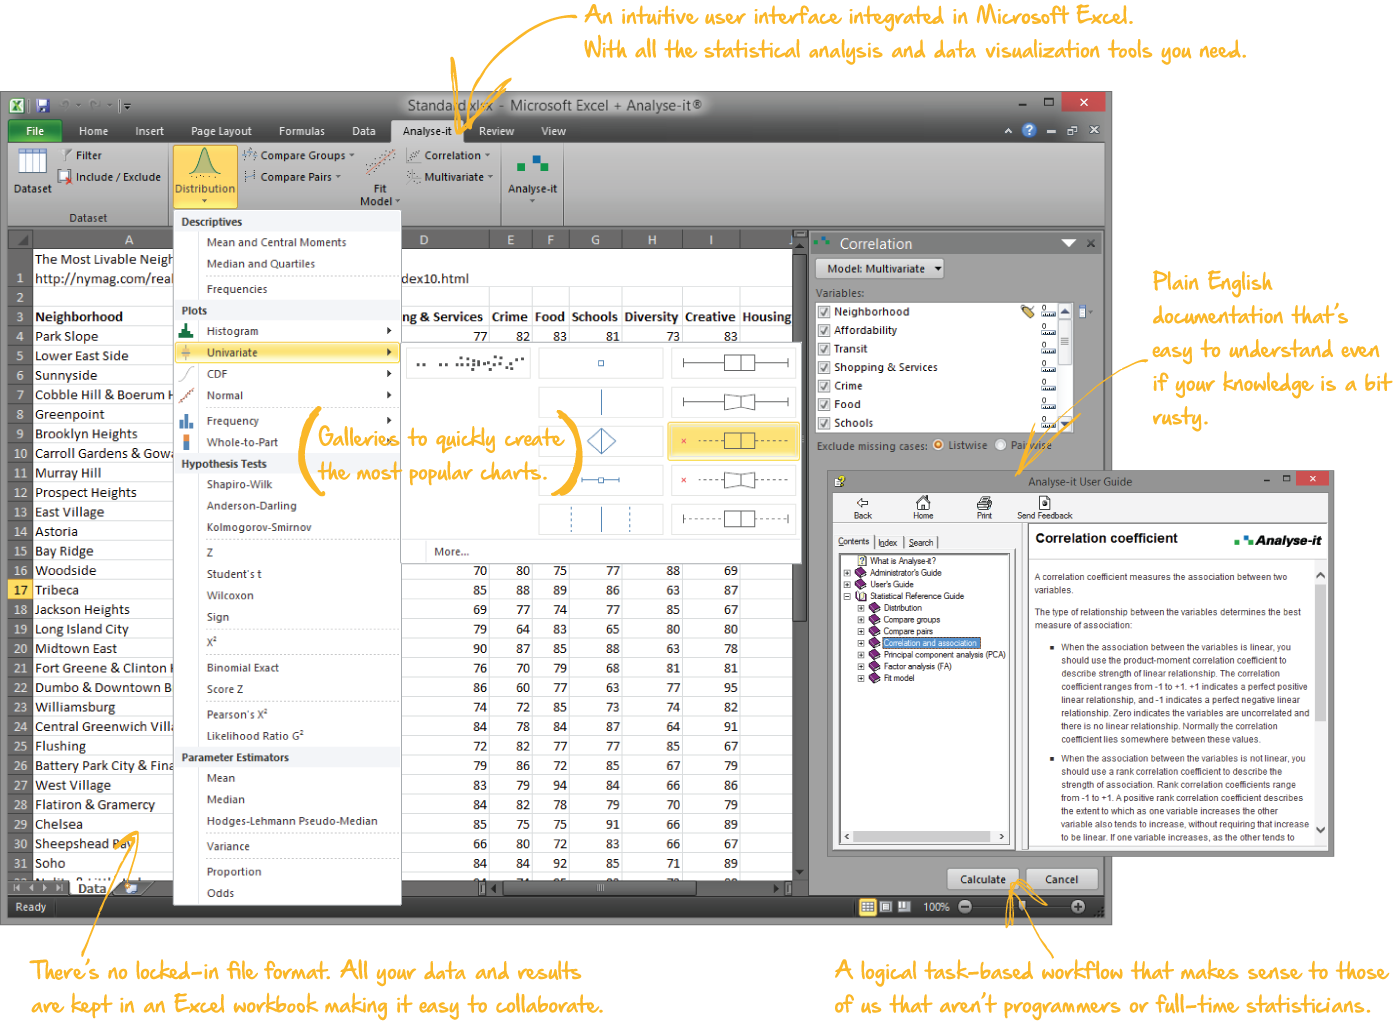
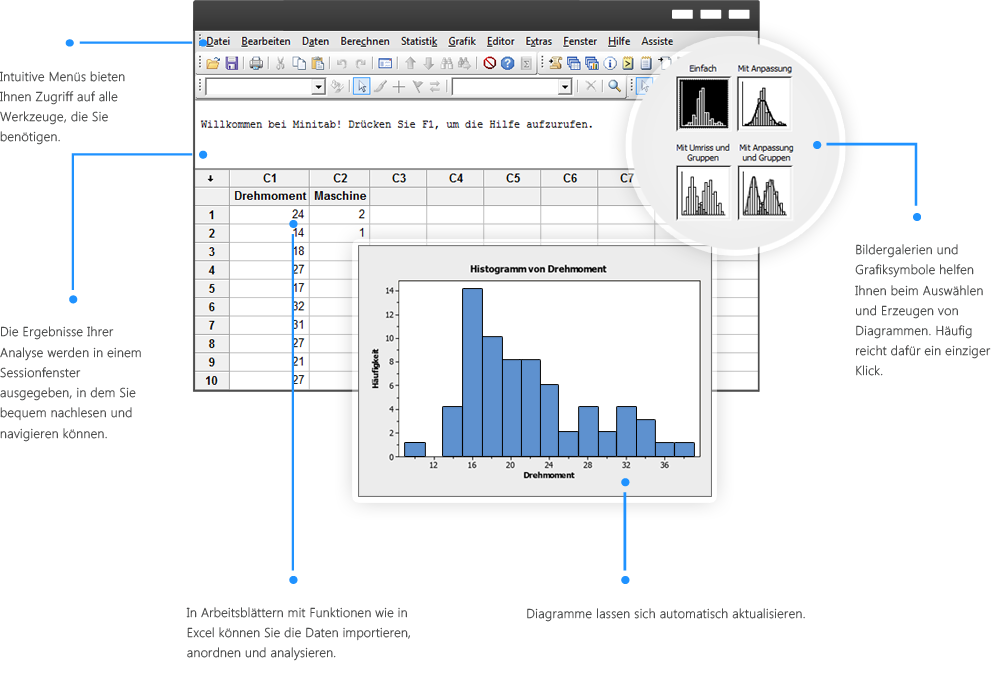
Minitab's interface is intuitive and easy to use.
An extensive selection of statistical methods
Basic statistics
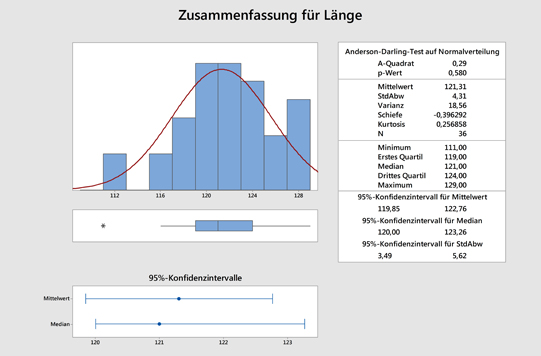
Access a complete set of statistical tools, including descriptive statistics, hypothesis tests, confidence Intervals and normality tests. | Regression and ANOVA
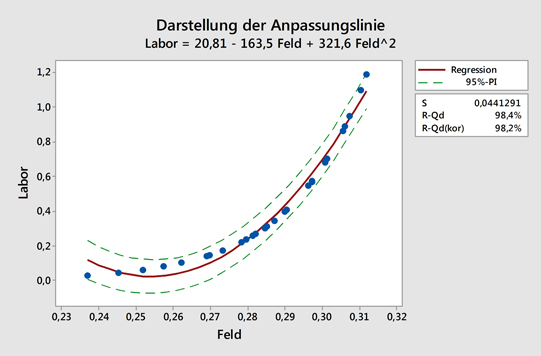
Uncover the relationships between variables and identify important factors affecting the quality of your products and services. | Quality tools
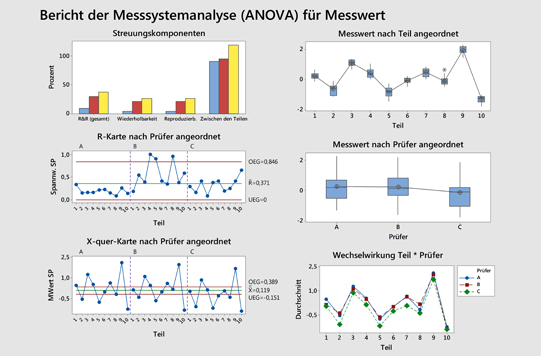
Determine if your measurement systems are adequate, assess how well your processes meet specification limits, create sampling plans, and more. |
 |  |  |
Design of Experiments (DoE)
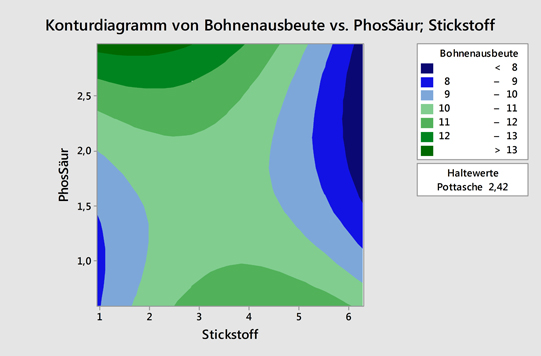
Find the settings that optimize your processes using factorial, response surface, mixture and Taguchi designs. | Control charts
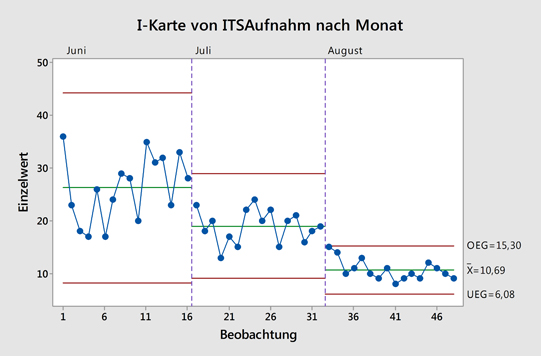
Monitor your processes over time and evaluate their stability. | Reliability and survival
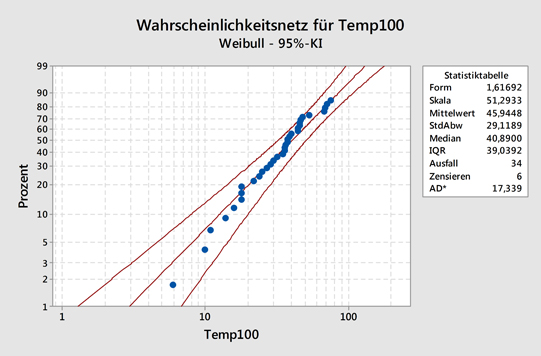
Determine a product's lifetime characteristics using a wide range of tools including distribution analysis and accelerated life testing. |
 |  |  |
Dig Deeper into your Data
Minitab graphs are powerful tools for investigating your process further and removing any doubt about the steps you should take to improve it.
 |  |
Automatically update your graphs and control charts when you add or edit data. | Select and examine points of interest, then use them to create alternate data sets and graphs. |
Share your Results
Sharing your findings with colleagues is easy. Minitab's assistant automatically produces a comprehensive, straightforward summary of your analysis that includes relevant graphs and output, and how to interpret them. And there is more, Minitab's rich graphs are the building blocks of an engaging and professional presentation. They are simple to edit, and you can export them directly to MS Word and PowerPoint.


