Design Expert® – Die erste Wahl für statistische Versuchsplanung (DoE)
Mit Design Expert optimieren Sie Ihr Produkt oder Ihren Prozess mit den Methoden der statistischen Versuchsplanung (Design of Experiments DoE).
Bei der Entwicklung von Design Expert wird besonderer Wert auf dessen Anwenderfreundlichkeit gelegt. Mit Design Expert finden Sie die relevanten Faktoren, optimalen Prozesseinstellungen oder das Prozessfenster, maximale Performance oder die beste Zusammensetzung für ein Produkt.
Design Expert bietet eine große Vielfalt möglicher Designs mit jeweils vielen Optionen und Einstellungen. Design Expert bietet große Flexibilität beim Handling Kategorialer Faktoren (Einflussgrössen). Es sind sogar Kombinationen mit Mixtur- und /oder Prozessvariablen möglich. Nach der Design Definition generieren Sie ein Arbeitsblatt für Ihr Experiment in randomisierter Reihenfolge der Einzelexperimente. Das Hinzufügen, Löschen oder Duplizieren einzelner "runs" erledigt der "design editor".
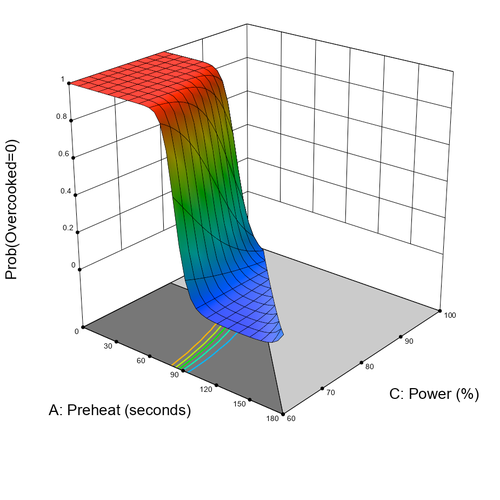
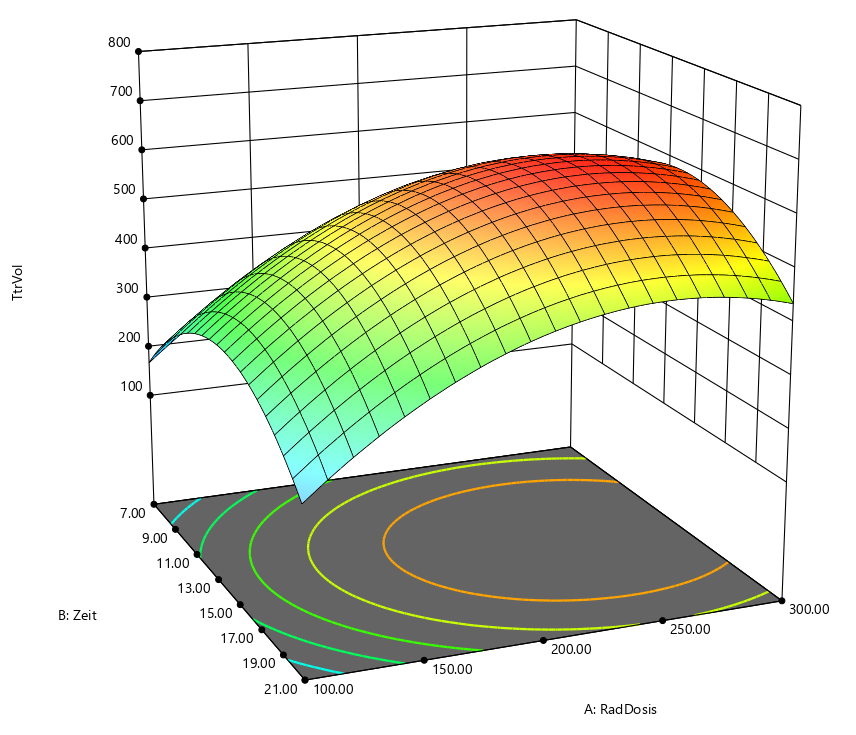
Mit kommentierten statistischen Analysen und der ausführlichen kontextsensitiven Hilfe kann beinahe jeder die Ergebnisse interpretieren. Die interaktiven 2-D Grafiken bieten viele sinnvolle Informationen auf fast spielerische Weise, z.B. das ziehen von Höhenlinien oder die Darstellung der Koordinaten eines beliebigen Punktes im Plot. Mit rotierbaren 3-D Diagrammen erhalten Sie ein Werkzeug um gefundene Zusammenhänge optimal zu visualisieren.
Mit dem Optimierungsalgorithmus in Design Expert können dutzende Zielgrössen oder "Wünschbarkeitsfunktionen" (desirability functions) gleichzeitig maximiert werden. Ausserdem gibt es einmalige Möglichkeiten die Fehlerfortpfanzung (propagation of error POE) zu ermitteln und graphisch darzustellen. Damit wird es auch möglich, das Ziel der Variationsreduktion im Rahmen von z.B. einem Six-Sigma Projekt zu erreichen. Maximieren, Minimieren oder Erreichen von Zielvorgaben mit Faktoreinstellungen die robust sind. Noch nie war die statistische Versuchsplanung so einfach und effizient!
Allgemeine Features zur statistischen Versuchsplanung (DoE) mit Design Expert
Leitungsfähig, trotzdem anwenderfreundlich
Weil es als spezialisiertes DoE Programm konzipiert ist bietet Design-Expert viele Features die die Einfachheit der Bedienung garantieren. Diese Funktionen finden Sie nicht in allgemeinen Statistikprgrammen. Neben einer grossen Zahl verschiedener Plantypen bietet Design Expert auch die notwendige Flexibilität die Versuchspläne an Ihre Anfroderungen anzupassen. Darüberhinaus werden einzigartige Möglichkeiten geboten das Design zu bewerten, das richtige Modell für Ihre Zielgrössen zu finden, Graphiken zu erstellen die die Interpretation erleichtern, mehrere Zielgrössen zu optimieren sowie eine intuitive Benutzerführung und ein erheblich erweitertes Hilfesystem.
DoE für alle experimentellen Situationen
- Standard zwei-stufige voll- und teilfaktorielle Pläne (bis zu 256 runs) für bis zu 15 Faktoren jetzt auch mit "minimum-aberration blocking"
- Allgemeine mehrstufige faktorielle Designs (bis zu 32000 runs) auch mit unterschiedlicher Anzahl der Faktorstufen für verschiedene Faktoren
- Taguchi Orthogonale Felder
- nicht reguläre Teilversuchspläne mit hoher Auflösung, wie z.B. 4 Faktoren in 12 runs
- Placket-Burman Designs für 11, 19, 23, 27 oder 31 Faktoren in 12, 20, 24, 28 oder 32 runs
- Response Surface Methode (RSM) Designs, einschliesslich zentral-zusammengesetzer Pläne (small, face-centered, etc.), Box- Behnken 3-stufige Pläne, hybride und D-Optimal Pläne
- Mixturpläne, wie Simplex-Lattice, Simplex-Centroid (für bis zu 24 Komponenten) und D-Optimale Pläne
- Kombinierte Mixtur und Prozess Pläne (Teigmischen und den Kuchen backen in einem Plan!)
- Möglichkeit zur Darstellung beliebiger Datenspalten X und Y als Graphik (gut für die Visualisierung von Blockeffekten)
- Leicht bedienbare automatische oder manuelle Modellreduktion
- Möglichkeit der einfachen Auswertung für Designs mit fehlenden Daten
Flexibibltät bei der Anpassung des Designs auf Ihre Bedingungen
- Definieren Sie Ihre eigenen Generatoren für faktorielle Teilversuchspläne
- Setzen Sie lineare, mulitfaktorielle Nebenbedingungen für RSM und Mixturpläne
- Arbeiten Sie mit kategorialen Faktoren in RSM, Mixtur oder gemischten Plänen
- Erzeugen Sie einen faktoriellen "Candidate Set" für RSM designs wenn nur bestimmte Faktorstufen möglich sind
- Ignorieren einer kompletten Datenzeile ohne die Werte zu löschen
Statistische Datenanalyse schafft Vertrauen
- Falls Ihr Modell vermengt sein sollte, weist ein Warnmeldung darauf hin bevor die ANOVA Ergebnisse für einen zwei-stufigen faktoriellen Teilversuchsplan erscheinen und gibt Ihnen die Möglichkeit die vermengten Effekte zu ersetzen.
- Sie können optional verschiedene kommentierte Ansichten auswählen, die Ihnen helfen die Ergebnisse der Varianzanalyse ANOVA zu interpretieren
- Sie können die einzelnen F-Tests für jeden Term des Modells sowie die Konfidenzintervalle der Koeffizienten anzeigen
- Effekte können automatisch anhand des Kriteriums von "Lenth" oder anhand der Wahrscheinlichkeiten (p-values) gewählt werden.
- Die neuen Einstellungen ermöglichen z.B. die gobale Änderung der Signifikanzschwelle (0,05 voreingestellt auf 0,01 oder 0,1)
Leistungsfähige Tools für die Modellanpassung
- Ändern Sie das Grundmodell zwischen RSM und Faktoriell bzw. zwischen Scheffe (Mixtur) und "slack" (während der Design Phase und bei der Modellauswahl)
- Ganzahlige Potenzen können den Modelltermen zugeordnet werden, z.B. cubisch
- Wählen Sie Terme für das Modell, den Fehler oder Terme die ignoriert werden sollen (ermöglicht die Auswertung von Split-Plot und geschachtelten Designs)
Hervorragende Grafiken vereinfachen die Interpretation
- Durch einen Klick auf den Statusknopf erhalten Sie eine kurze Darstellung des Design Typs, Informationen zu den Faktoren, der Zielgröße sowie dem Modell
- Halb-Normale und Normal Wahrscheinlichkeitsplots geben einen Überblick über die signifikanten Effekte. Durch spezielle Punkte, die Schätzer für "pure error" darstellen (sofern Ihr Design dies erlaubt).
- Ein Box-Cox Plot gibt Hinweise für die beste Transformation der Zielgrösse
- Die komplette Liste verschiedener Plots zur Überprüfung der statistischen Annahmen und zum prüfen auf mögliche Ausreisser. Es kann auch ein Graph der vorhergesagten Werte gegen die tatsächlichen Werte einschliesslich der 45º Linie erzeugt werden
- Erstellen Sie Grafiken von alternativen, aber vermengten Wechselwirkungen
- Stellen Sie die Effekt Plot mit der original Skalierung Ihrer Zielgrösse dar, auch nachdem Sie diese bereits transformiert haben
- Beobachten Sie die Güte der Vorhersage indem Sie Balken für die kleinste signifikante Differenz (LSD) in der Modellgraphik darstellen
- Ungenau vorhergesagbare Bereiche werden in den Höhenliniendarstellungen schattiert, um Ihnen "sichere" Vorhersagen zu ermöglichen.
- Sie können den Contourplot für verschiedene Werte der nicht sichtbaren Faktoren mittels eines Rollbalkens verschieben. Sobald ein Designpunkt genau an die gewählte Wertekombination hat wird dieser dargestellt!
- Setzen Sie Beschriftungen mit den vorhergesagten Werten der Zielgrösse an beliebige Positionen
- Ziehen Sie die 2-D Contourlinien mit der Maus
- 3-D Graphiken können rotiert werden dabei werden die projezierten 2-D Höhenlinien mit dargestellt
- Sie können Farben, Texte und viele andere Eigenschaften der Graphik anpassen
- Zeigen Sie alle Effekte in einer Graphik (mit trace und perturbation Plots)
- Den Standardfehler des Designs können Sie in jedem Graphen darstellen (Contour, 3D, usw..)
Mit der optimierung für mehrere Zielgrössen finden Sie Ihren Arbeitspunkt
- Maximieren, Minimieren oder geben Sie Zielwerte vor (für Zielsgrössen und Faktoren)
- Priorisieren Sie die einzelnen Zielgrössen durch Gewichtungen
- Sie können zwischen 2-D Höhenlinien-, 3-D Oberflächen, Histogramm oder einer Graphik der "Wünschbarkeitsfunktion" auswählen.
- Kategorial Faktoren können berücksichtigt werden
- Faktoren können auf konstant Werte eingestellt werden
- Sie können weitere Zielgrössen in Form einer Gleichung angeben, wie z.B. eine Kostenfunktion
- Der Overlay Plot zeigt die Nebenbedingung (Einschränkungen), die Sie für Ihren Prozess oder die Mixtur gesetzt haben
- Sie können Vorhersagen für die Zielgrössen für beliebige Bedingungen erstellen (einschliesslich Vertrauensniveau - confidence level)
Achieve "Six-Sigma" Goals
- Explore propagation of error (POE) for mixtures, crossed designs and transformed responses, as well as RSM
- For purposes of POE, enter your own response standard deviation or set it at zero
Save Time with Design-Expert
- Easily maneuver through the program: down trees, through wizards, and across progressive toolbars
- Quickly select the next step with incredibly easy-to-use push-buttons
- Open reports and graphs for automatic updating
- View numerical outputs spreadsheet style
- Cut and paste graphics to your word processor or presentation, or numbers to and from a spreadsheet
- Export any grid view as ASCII text, for example, design layouts or ANOVA reports
- View several graphs simultaneously using the handy pop-out option
- 32-bit architecture provides maximum performance on Windows 95, 98, 2000, NT and beyond
- Access graphic and spreadsheet options instantly with a simple right click
- Choose significant terms to plot from the pull-down list on the Factors Tool
Find the Answers to your Questions in the Expanded Help System (All new!)
- Greatly improved context-sensitive help provides immediate response
- Better guidance helps you choose the best model
- A bonus help section provides "quick start" advice to novices
- Special user tips offer hints not normally found in help systems


