NCSS und PASS - gebündelte Power für Ihren Erfolg!
1. NCSS ist ein robustes Statistik- und Grafikprogramm, das in einer Vielzahl von Branchen eingesetzt wird, von medizinischen Untersuchungen und Geschäftsanalysen bis hin zu Ingenieurwesen, Qualitätskontrolle und akademischer Forschung. Erfahren Sie, warum Tausende von Forschern, Beratern, Fachleuten, Ingenieuren und Wissenschaftlern NCSS weltweit einsetzen.
2. PASS bietet Stichprobengrößenberechnungen bietet mit 370 Szenarien mehr als jede andere Stichprobengrößen-Software und ist das führende Softwaretool zur Bestimmung der erforderlichen Stichprobengröße oder zur Analyse der Leistung einer Studie. PASS wird in großem Umfang in der Planung klinischer Studien, in der pharmazeutischen Forschung, in der statistischen und biostatistischen Beratung, in der Gesundheitsforschung und in vielen anderen Bereichen der Studienplanung und Studienbewertung eingesetzt.
Dies könnte Sie auch interessieren
NCSS
PASS
NCSS und PASS - beide Tools in einem Bundle
Das Bundle aus NCSS und PASS in der aktuellen Version stellt Ihnen alle Funktionen beider Programme zur Verfügung. Eine Kombination die sich perfekt ergänzt!
PASS im Überblick:
PASS ist ein einfaches und zugleich mächtiges Programm zur Festlegung des Versuchsumfangs. PASS führt Power-Analysen durch und berechnet Stichprobengrößen für über 680 statistische Tests. PASS besitzt darüber hinaus die umfangreichste Sammlung an Tools zur Analyse von Stichprobengrößen auf den Markt. Die umfangreiche Software unterstützt Sie durch ein integriertes Hilfemenü mit ausführlichen Material.
Mit PASS bekommen Sie Power!
- Umfassendes Programm zur Berechnung von Stichprobengrößen und Trennschärfe
- Die Genauigkeit der Prozeduren ist gut validiert
- Leicht zu lernen und schnell anwendbar
- Preis und Leistung stimmen
- Standalone - Kommt ohne das Vorhandensein anderer Statistikprogramme aus
- Gute, flexible Grafik
- Der Output wird in verständlichen (englischen) Sätzen erläutert
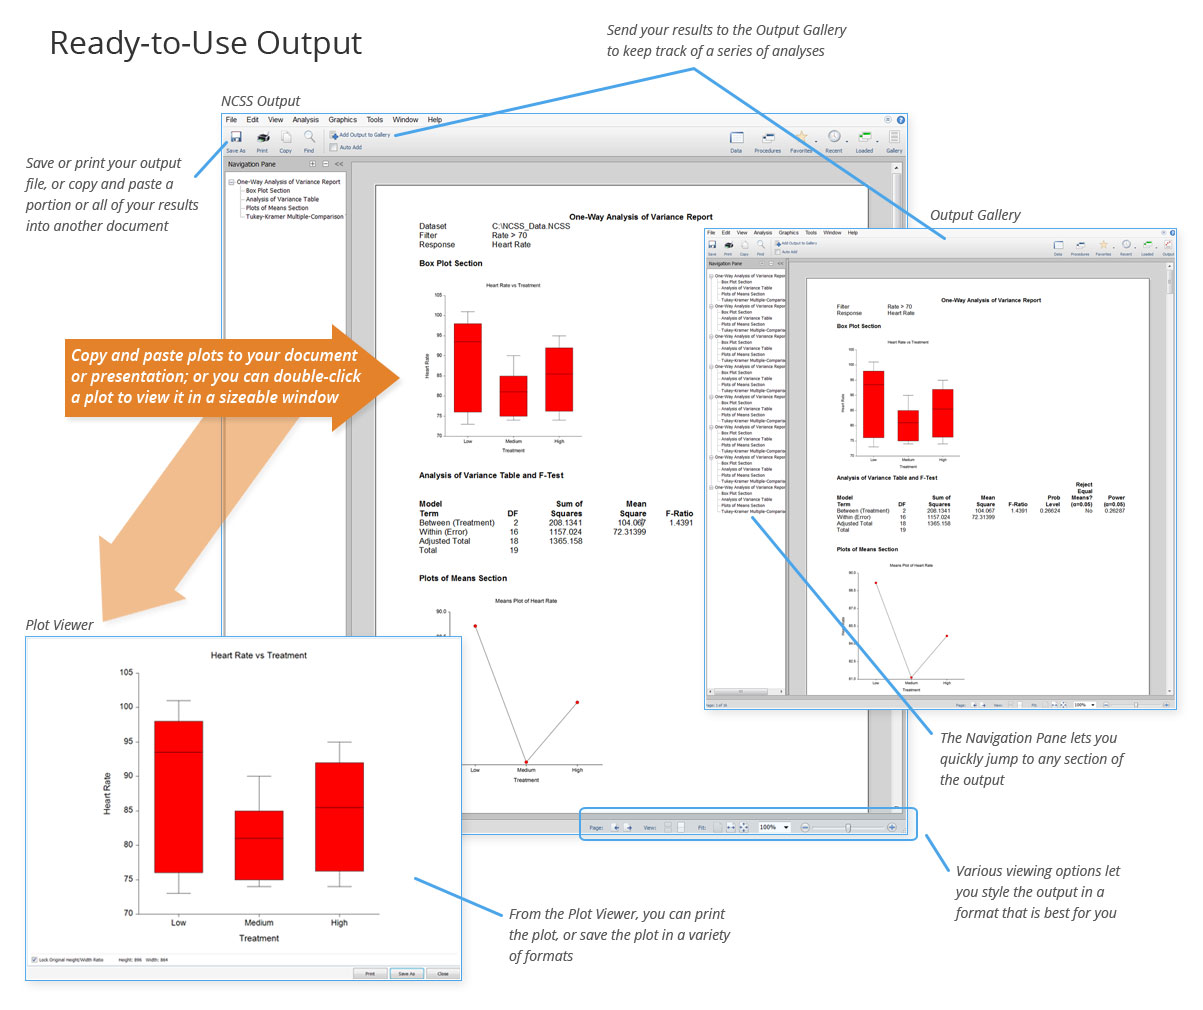
- Der Output kann zu gängigen Textverarbeitungsprogrammen übertragen werden.
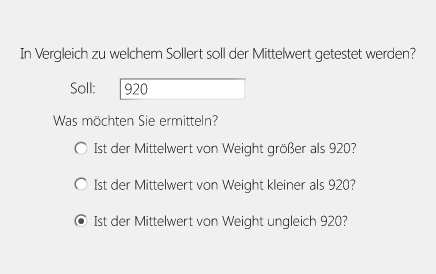
Auswahl einer Prozedur |
Dateneingabe |
NCSS - Das System zur Statistischen Analyse
NCSS ist ein umfassendes, leicht zu bedienendes Statistik-Softwarepaket. NCSS Software bietet eine komplette und einfach zu bedienende Sammlung von Hunderten von Statistik- und Grafikwerkzeuge zur Analyse und Visualisierung Ihrer Daten.
- Umfassend und genau
- Preisgünstig
- Beinhaltet mehr als 150 statistische und grafische Tools zur Datenanalyse und -Visualisierung.
- Leicht zu lernen und benutzerfreundlich.
- NCSS ist voll komptibel mit den 32 und 64 Bit Versionen von Windows XP/Vista, Windows 7, 8 und Windows 10!
- Import/Export aller wichtigen Tabellenkalkulations-, Datenbank- und statischer Datei- Formate.
- Ausgabe von gemischtem Text und Grafiken. Einfache Übertragung in die gängigen Textverarbeitungs- und Präsentationsprogramme wie z.B. Word und PowerPoint.
- Es können große Daten-Files verabeitet werden ( mehr als 1.000 Variablen und 200.000 Zeilen)
Entdecken Sie NCSS
Eine Prozedur in NCSS auswählen |
Weitere Informationen:
- PASS und NCSS Homepage beim Hersteller NCSS in den USA
- Dokumentation der Software PASS auf der Hersteller-Website
Minimum System Requirements for PASS
In order to run PASS 16, your computer must meet the following minimum standards:
- Processor:
- 450 MHz or faster processor
- 32-bit (x86) or 64-bit (x64) processor
- RAM:
- 256 MB (512 MB recommended)
- Operating Systems:
- Windows 10 or later
- Windows 8.1
- Windows 8
- Windows 7
- Windows Vista with Service Pack 2 or higher
- Windows Server 2016 or later
- Windows Server 2012 R2
- Windows Server 2012
- Windows Server 2008 SP2/R2
- Privileges:
- Administrative rights required during installation only
- Third Party Software:
- Microsoft .NET 4.6 (Comes pre-installed with Windows 10 or later and Windows Server
2016 or later. Installation required on Windows 8.1 or earlier and Windows Server
2012 R2 or earlier. For systems where .NET 4.6 installation is required, a .NET 4.6
download helper will start automatically when you run the PASS setup file.) - Microsoft Windows Installer 3.1 or higher
- Adobe Reader® 7 or higher (required for the Help System only)
- Microsoft .NET 4.6 (Comes pre-installed with Windows 10 or later and Windows Server
- Hard Disk Space:
- 220 MB for PASS (plus space for Microsoft .NET 4.6 if not already installed)
- Printer:
- Any Windows-compatible inkjet or laser printer
Pass unter MAC OS X
Für eine Nutzung der Software auf einem MAC-Betriebssystem benötigen Sie einen Windows Emulator, wie z.B. Parallels!
Minimum System Requirements for NCSS
These are the computer requirements in order to run NCSS 12 Statistical Analysis Software:
- Processor:
- 450 MHz or faster processor
- 32-bit (x86) or 64-bit (x64) processor
- RAM:
- 256 MB (512 MB recommended)
- Operating Systems:
- Windows XP with Service Pack 2 or higher
- Windows Vista
- Windows 7
- Windows 8 and 8.1
- Windows 10 or later
- Windows Server 2003
- Windows Server 2008
- Windows Server 2008 R2
- Windows Server 2012
- Windows Server 2012 R2 or later
- Privileges:
- Administrative rights required during installation only
- Third Party Software:
- Microsoft .NET 3.5 SP1 (included with NCSS CD, comes pre-installed with Windows 7 and Windows Server 2008 R2, feature activation required on Windows 8, 8.1, 10 and Windows Server 2012 and 2012 R2)
- Microsoft Windows Installer 3.1 or higher
- Adobe Reader® 7 or higher (required for the Help System only)
- Hard Disk Space:
- 160 MB for NCSS (plus space for Microsoft .NET 3.5 SP1 if not already installed)
- Printer:
- Any Windows-compatible inkjet or laser printer
NCSS unter MAC OS X
Für den Betrieb von NCSS unter Mac OS X ist ein Windows Emulator, wie z.B. Parallels notwendig!
What's New in PASS 2020?
PASS adds 38 new sample size procedures and 33 updated or improved procedures. Among the new and updated procedures are those for
|
- Group-Sequential Tests for Hazard Rates, Means, and Proportions (Superiority and Non-Inferiority)
- GEE Tests for Means, Proportions, and Poisson Rates in a Cluster-Randomized Design
- Post-Marketing Surveillance for Poisson Rates
- Tests for Means and Proportions a Split-Mouth Design
- Confidence Intervals in Cluster and Stratified Designs
- Tests for Means and Proportions in Cluster-Randomized Designs
- Tests for Multiple Proportions and Poisson Rates
- Tests for One Exponential Hazard Rate
- Equivalence Tests for the Ratio of Two Means (Normal Data)
- Updated Randomization Lists (Block Randomization and Stratified Lists)
- Updated Conditional Power and Sample Size Re-estimation of Means, Proportions, 2×2 Cross-Over Designs, and Logrank Tests
- Updated One-Way ANOVA
- Updated Simplified Simulation Procedures for One Mean, Paired Means, Two Means, and Mann-Whitney Tests
- Updated McNemar Test
- Updated Cochran-Mantel-Haenszel Test
For the 11 new group-sequential sample size procedures in PASS , there are corresponding group-sequential analysis and sample-size re-estimation procedures in NCSS
What's New in NCSS 2020?
- Group-Sequential Analysis for Hazard Rates, Means, and Proportions (Superiority and Non-Inferiority)
- Simple and Stratified Dataset Random Sampling Tools
- At-Risk Tables Added to Applicable Plots in All Survival/Reliability Procedures
- Heatmaps Added to Factor Analysis and PCA Procedures
- Tukey-Pairwise and Dunnett’s Many-to-One (Control) Multiple Comparisons Tests for Proportions Added to Contingency Tables (Crosstabs / Chi-Square Test)
- Block Randomization and Stratified Lists Added to the Randomization Lists Procedure
- Data Window Improvements (Now Requires up to 70% Less Memory to Load the Same Amount of Data)
- Improved Algorithms for the Standardized Range Probability Distribution
More Procedures NCSS
Addition of new procedures and tests:
- Paired T-Test for Superiority by a Margin
- One-Sample T-Test for Non-Inferiority
- One-Sample T-Test for Superiority by a Margin
- One-Sample T-Test for Equivalence
- Two-Sample T-Test for Superiority by a Margin
- –
- Analysis of 2×2 Cross-Over Designs using T-Tests for Non-Inferiority
- Analysis of 2×2 Cross-Over Designs using T-Tests for Superiority by a Margin
- Analysis of 2×2 Cross-Over Designs using T-Tests for Equivalence
- –
- One Proportion – Non-Inferiority Tests
- One Proportion – Superiority by a Margin Tests
- One Proportion – Equivalence Tests
- –
- Two-Sample Non-Inferiority Tests for Survival Data using Cox Regression
- Two-Sample Superiority by a Margin Tests for Survival Data using Cox Regression
- Two-Sample Equivalence Tests for Survival Data using Cox Regression
- –
- Cluster Randomization – Create Cluster Means Dataset
- Cluster Randomization – Create Cluster Proportions Dataset
- Cluster Randomization – Create Cluster Rates Dataset
- –
- General Linear Models (GLM) for Fixed Factors
- –
- One-Way Analysis of Covariance (ANCOVA)
- Analysis of Covariance (ANCOVA) with Two Groups
- –
- Clustered Heat Maps (Double Dendrograms)
Examples of new plots:
- Clustered Heat Map (Double Dendrogram)
What’s New in PASS
We are pleased to announce the release of PASS. PASS adds 55 new sample size procedures, including new procedures for the odds ratio in logistic regression, generalized estimating equation (GEE) tests, repeated measures design tests, cross-over design proportions tests, tests for two Poisson rates in cross-over designs, ordinal data tests in cross-over designs, pairwise proportion differences in a Williams cross-over design, tests for comparing two or more time-averaged differences, multiple group slope tests, mixed models tests for two means/proportions/slopes in hierarchical designs, tests for multiple correlated proportions, and more.
Installation Qualification (IQ) and Operational Qualification (OQ) tools were added in PASS.
Report section options give the user flexibility to enhance output readability.
New Procedures in PASS
Logistic Regression
- Tests for the Odds Ratio in Logistic Regression with One Normal X (Wald Test)
- Tests for the Odds Ratio in Logistic Regression with One Normal X and Other Xs (Wald Test)
- Tests for the Odds Ratio in Logistic Regression with One Binary X and Other Xs (Wald Test)
Repeated Measures Slopes (GEE)
- GEE Tests for the Slope of Two Groups in a Repeated Measures Design (Continuous Outcome)
- GEE Tests for the Slope of Two Groups in a Repeated Measures Design (Binary Outcome)
- GEE Tests for the Slope of Two Groups in a Repeated Measures Design (Count Outcome)
- –
- GEE Tests for the Slope of Multiple Groups in a Repeated Measures Design (Continuous Outcome)
- GEE Tests for the Slope of Multiple Groups in a Repeated Measures Design (Count Outcome)
Repeated Measures Time-Averaged Differences (GEE)
- GEE Tests for the TAD of Two Groups in a Repeated Measures Design (Continuous Outcome)
- GEE Tests for the TAD of Two Groups in a Repeated Measures Design (Binary Outcome)
- GEE Tests for the TAD of Two Groups in a Repeated Measures Design (Count Outcome)
- –
- GEE Tests for the TAD of Multiple Groups in a Repeated Measures Design (Continuous Outcome)
- GEE Tests for the TAD of Multiple Groups in a Repeated Measures Design (Binary Outcome)
- GEE Tests for the TAD of Multiple Groups in a Repeated Measures Design (Count Outcome)
Hierarchical Design Comparisons using Mixed Models
- Mixed Models Tests for Two Means in a 2-Level Hierarchical Design (Level-2 Randomization)
- Mixed Models Tests for Two Means in a 2-Level Hierarchical Design (Level-1 Randomization)
- –
- Mixed Models Tests for Two Proportions in a 2-Level Hierarchical Design (Level-2 Randomization)
- Mixed Models Tests for Two Proportions in a 2-Level Hierarchical Design (Level-1 Randomization)
- –
- Mixed Models Tests for the Slope Difference in a 2-Level Hierarchical Design with Fixed Slopes
- Mixed Models Tests for the Slope Difference in a 2-Level Hierarchical Design with Random Slopes
- –
- Mixed Models Tests for Two Means in a 3-Level Hierarchical Design (Level-3 Randomization)
- Mixed Models Tests for Two Means in a 3-Level Hierarchical Design (Level-2 Randomization)
- Mixed Models Tests for Two Means in a 3-Level Hierarchical Design (Level-1 Randomization)
- –
- Mixed Models Tests for Two Proportions in a 3-Level Hierarchical Design (Level-3 Randomization)
- Mixed Models Tests for Two Proportions in a 3-Level Hierarchical Design (Level-2 Randomization)
- Mixed Models Tests for Two Proportions in a 3-Level Hierarchical Design (Level-1 Randomization)
- –
- Mixed Models Tests for the Slope Diff. in a 3-Level Hier. Design with Fixed Slopes (Level-2 Rand.)
- Mixed Models Tests for the Slope Diff. in a 3-Level Hier. Design with Random Slopes (Level-2 Rand.)
- Mixed Models Tests for the Slope Diff. in a 3-Level Hier. Design with Fixed Slopes (Level-3 Rand.)
- Mixed Models Tests for the Slope Diff. in a 3-Level Hier. Design with Random Slopes (Level-3 Rand.)
2×2 Cross-Over Design – Odds Ratio
- Tests for the Odds Ratio of Two Proportions in a 2×2 Cross-Over Design
- Non-Inferiority Tests for the Odds Ratio of Two Proportions in a 2×2 Cross-Over Design
- Superiority by a Margin Tests for the Odds Ratio of Two Proportions in a 2×2 Cross-Over Design
- Equivalence Tests for the Odds Ratio of Two Proportions in a 2×2 Cross-Over Design
2×2 Cross-Over Design – Proportion Difference
- Tests for the Difference of Two Proportions in a 2×2 Cross-Over Design
- Non-Inferiority Tests for the Difference of Two Proportions in a 2×2 Cross-Over Design
- Superiority by a Margin Tests for the Difference of Two Proportions in a 2×2 Cross-Over Design
- Equivalence Tests for the Difference of Two Proportions in a 2×2 Cross-Over Design
2×2 Cross-Over Design – Ratio of Poisson Rates
- Tests for the Ratio of Two Poisson Rates in a 2×2 Cross-Over Design
- Non-Inferiority Tests for the Ratio of Two Poisson Rates in a 2×2 Cross-Over Design
- Superiority by a Margin Tests for the Ratio of Two Poisson Rates in a 2×2 Cross-Over Design
- Equivalence Tests for the Ratio of Two Poisson Rates in a 2×2 Cross-Over Design
2×2 Cross-Over Design – Generalized Odds Ratio for Ordinal Data
- Tests for the Generalized Odds Ratio for Ordinal Data in a 2×2 Cross-Over Design
- Non-Inferiority Tests for the Generalized Odds Ratio for Ordinal Data in a 2×2 Cross-Over Design
- Superiority by a Margin Tests for the Gen. Odds Ratio for Ordinal Data in a 2×2 Cross-Over Design
- Equivalence Tests for the Generalized Odds Ratio for Ordinal Data in a 2×2 Cross-Over Design
Williams Cross-Over Design – Pairwise Proportion Differences
- Tests for Pairwise Proportion Differences in a Williams Cross-Over Design
- Non-Inferiority Tests for Pairwise Proportion Differences in a Williams Cross-Over Design
- Superiority by a Margin Tests for Pairwise Proportion Differences in a Williams Cross-Over Design
- Equivalence Tests for Pairwise Proportion Differences in a Williams Cross-Over Design
Williams Cross-Over Design – Pairwise Mean Differences
- Tests for Pairwise Mean Differences in a Williams Cross-Over Design
- Non-Inferiority Tests for Pairwise Mean Differences in a Williams Cross-Over Design
- Superiority by a Margin Tests for Pairwise Mean Differences in a Williams Cross-Over Design
- Equivalence Tests for Pairwise Mean Differences in a Williams Cross-Over Design
Multiple Correlated Proportions (McNemar-Bowker Test of Symmetry)
- Tests for Multiple Correlated Proportions (McNemar-Bowker Test of Symmetry)
Weitere Funktionen der Software PASS
PASS erweitert die Software über 25 neue Power- und Stichproben Prozeduren. Über 45 Prozeduren wurden verbessert oder verändert.
Neue Prozeduren
Means
- Equivalence Tests for the Difference Between Two Paired Means
- Non-Inferiority Tests for Two Means in a Cluster-Randomized Design
- Equivalence Tests for Two Means in a Cluster-Randomized Design
- Superiority by a Margin Tests for Two Means in a Cluster-Randomized Design
- Tests for the Difference of Two Means in a Higher-Order Cross-Over Design
- Tests for the Ratio of Two Means in a Higher-Order Cross-Over Design
- Tests for Fold Change of Two Means
- MxM Cross-Over Designs
- M-Period Cross-Over Designs using Contrasts
- One-Way Repeated Measures
- One-Way Repeated Measures Contrasts
- One-Way Analysis of Variance Contrasts
- Confidence Intervals for One-Way Repeated Measures Contrasts
Rates and Counts
- Tests for the Difference Between Two Poisson Rates
- Tests for the Difference Between Two Poisson Rates in a Cluster-Randomized Design
- Tests for the Ratio of Two Negative Binomial Rates
Survival
- Logrank Tests in a Cluster-Randomized Design
- One-Sample Logrank Tests
- One-Sample Cure Model Tests
Regression
- Reference Intervals for Clinical and Lab Medicine
- Tests for the Difference Between Two Linear Regression Slopes
- Tests for the Difference Between Two Linear Regression Intercepts
- Mendelian Randomization with a Binary Outcome
- Mendelian Randomization with a Continuous Outcome
Acceptance Sampling
- Acceptance Sampling for Attributes
- Operating Characteristic Curves for Acceptance Sampling for Attributes
Verbesserte oder Veränderte Prozeduren in PASS
Means
- Tests for Two Means using Ratios
- Tests for Two Means in a Cluster-Randomized Design
- Non-Inferiority Tests for the Difference of Two Means in a Higher-Order Cross-Over Design
- Non-Inferiority Tests for the Ratio of Two Means in a Higher-Order Cross-Over Design
- Equivalence Tests for the Difference of Two Means in a Higher-Order Cross-Over Design
- Equivalence Tests for the Ratio of Two Means in a Higher-Order Cross-Over Design
- Superiority by a Margin Tests for the Difference of Two Means in a Higher-Order Cross-Over Design
- Superiority by a Margin Tests for the Ratio of Two Means in a Higher-Order Cross-Over Design
- One-Way Analysis of Variance F-Tests
Rates and Counts
- Tests for One Poisson Rate
- Tests for the Ratio of Two Poisson Rates
Proportions
- Tests for One Proportion
- Non-Inferiority Tests for One Proportion
- Equivalence Tests for One Proportion
- Superiority by a Margin Tests for One Proportion
- Tests for Two Proportions
- Tests for Two Proportions in a Repeated Measures Design
- Non-Inferiority Tests for the Difference Between Two Proportions
- Non-Inferiority Tests for the Ratio of Two Proportions
- Non-Inferiority Tests for the Odds Ratio of Two Proportions
- Equivalence Tests for the Difference Between Two Proportions
- Equivalence Tests for the Ratio of Two Proportions
- Equivalence Tests for the Odds Ratio of Two Proportions
- Superiority by a Margin Tests for the Difference Between Two Proportions
- Superiority by a Margin Tests for the Ratio of Two Proportions
- Superiority by a Margin Tests for the Odds Ratio of Two Proportions
- Confidence Intervals for the Difference Between Two Proportions
- Confidence Intervals for the Ratio of Two Proportions
- Confidence Intervals for the Odds Ratio of Two Proportions
- Tests for Two Correlated Proportions (McNemar Test)
- Non-Inferiority Tests for the Difference Between Two Correlated Proportions
- Non-Inferiority Tests for the Ratio of Two Correlated Proportions
- Equivalence Tests for the Difference Between Two Correlated Proportions
- Equivalence Tests for the Ratio of Two Correlated Proportions
- Tests for Two Proportions in a Cluster-Randomized Design
- Non-Inferiority Tests for the Difference of Two Proportions in a Cluster-Randomized Design
- Non-Inferiority Tests for the Ratio of Two Proportions in a Cluster-Randomized Design
- Equivalence Tests for the Difference of Two Proportions in a Cluster-Randomized Design
- Equivalence Tests for the Ratio of Two Proportions in a Cluster-Randomized Design
- Superiority by a Margin Tests for the Difference of Two Proportions in a Cluster-Randomized Design
- Superiority by a Margin Tests for the Ratio of Two Proportions in a Cluster-Randomized Design
- Group-Sequential Tests for Two Proportions (Simulation)
- Group-Sequential Non-Inferiority Tests for the Difference of Two Proportions (Simulation)
- Group-Sequential Non-Inferiority Tests for the Ratio of Two Proportions (Simulation)
- Group-Sequential Non-Inferiority Tests for the Odds Ratio of Two Proportions (Simulation)
- Group-Sequential Superiority by a Margin Tests for the Difference of Two Proportions (Simulation)
- Group-Sequential Superiority by a Margin Tests for the Ratio of Two Proportions (Simulation)
- Group-Sequential Superiority by a Margin Tests for the Odds Ratio of Two Proportions (Simulation)
Funktionen der Software NCSS
Varianzanalyse
- Einwegvarianzanalyse
- Box-Cox-Transformation für zwei oder mehr Gruppen (T-Test-und One-Way ANOVA)
- Balanced Design-Varianzanalyse
- Allgemeine lineare Modelle (GLM)
- Wiederholte Messungen
- Multivariate Varianzanalyse (MANOVA)
- Analyse von Zwei-Level-Designs
- Nondetects-Data Group-Vergleich
- Fläche unter der Kurve
Clustering
- Fuzzy Clustering
- Hierarchical Clustering / Dendrogramme
- K-Means Clustering
- Medoid Partitioning
- Regression Clustering
Korrelation
- Lineare Regression und Korrelation
- Box-Cox-Transformation für die einfache lineare Regression
- Point-biserial und biserial Korrelationen
- Korrelationsmatrix
- kanonische Korrelations
- Lins Konkordanz Korrelationskoeffizient
- Bland-Altman-Diagramm und Analyse
Kurvenanpassung
- Michaelis-Menten-Gleichung
- Verhältnis von Polynomen Fit - Eine Variable
- Verhältnis von Polynomen Search - Eine Variable
- Referenzintervalle mit einer Kovariaten
- Summe der Funktionen innerhalb von Modellen
- Nichtlineare Regression
- Verhältnis von Polynomen Fit - viele Variablen
- Verhältnis von Polynomen Suche - viele Variablen
- Funktions-Plots
- Streudiagramm-Matrix für die Kurvenanpassung
Deskriptive Statistik
- Deskriptive Statistik - Übersichtstabellen
- Kontingenztabellen (Kreuztabellen / Chi-Quadrat-Test)
- Frequenztabellen
- Box-Cox-Transformation
- Daten Screening
- Daten Simulation
- Grubbs-Ausreißertest
- Normalitäts-Tests
- Stamm-und-Blatt-Diagramme
- Back-to-Back Stamm-und-Blatt-Diagramme
- Artikel-Analyse
- Item Response Analysis
- Fläche unter der Kurve
- Circular Datenanalyse
- Toleranzintervalle
Versuchsplanung
- Randomisierungslisten
- Balanced Incomplete Block-Designs
- Teilfaktorielle Designs
- Latin Square Designs
- Response Surface Designs
- Screening Designs
- Taguchi Designs
- Zwei-Level-Designs
- Design-Generator
- D-Optimal Designs
- Analyse von Zwei-Level-Designs
- Response Surface Regression
Zeitreihen
- ARIMA (Box-Jenkins)
- automatische ARMA
- theoretische ARMA
- Autokorrelationen
- Kreuzkorrelationen
- Spektralanalyse
- Decomposition Forecasting
- Exponentielles Glätten - Horizontal
- Exponentielles Glätten - Trend
- Exponentielle Glättung - Trend / Saisonale
- Harmonic Regression
- Analyse der Versuche
- Zeitreihen-Plots
Beurteilung von Massen
- Appraisal Ratios
- Vergleichsdaten - Verkaufspreis
- Hybrid Appraisal Models
- Deskriptive Statistik - Übersichtstabellen
- Multiple Regression
- Nichtlineare Regression
Meta-Analyse
- Meta-Analyse von Correlated Proportionen
- Meta-Analyse von Hazard Ratios
- Meta-Analyse von Means
- Meta-Analyse von Proportionen
- Forest Plots
Gemischte Modelle
- Gemischte Modelle - Keine wiederholten Messungen
- Gemischte Modelle - mit wiederholten Messungen
- Gemischte Modelle - Random Koeffizienten
Multivariate
- kanonische Korrelations
- Gleichheit der Kovarianz
- Faktorenanalyse
- Hauptkomponentenanalyse
- Diskriminanzanalyse
- Hotelling bei einer Stichprobe T2
- Hotelling Zwei-Stichproben T2
- Multivariate Varianzanalyse (MANOVA)
- Korrespondenzanalyse
- multidimensionale Skalierung
Nonparametric
- Analyse der Versuche
- Bootstrap-Konfidenzintervall (bei einer Stichprobe T-Test)
- Bootstrap-Konfidenzintervall (gepaarter t-Test)
- Bootstrap-Konfidenzintervall (Zwei-Stichproben-T-Test)
- Cochran-Q-Test
- kumulative Inzidenz
- Friedmans-Rang-Test (ausgewogenes Design ANOVA)
- Kaplan-Meier-Kurven (Logrank Tests)
- Kolmogorov-Smirnov-Test (Zwei-Stichproben-T-Test)
- Kruskal-Wallis-Test (One-Way ANOVA)
- Mann-Whitney U-Test (Zwei-Stichproben-T-Test)
- Nondetects-Data Group-Vergleich
- Randomisierung Test (bei einer Stichprobe T-Test)
- Randomisierung Test (gepaarter t-Test)
- Randomisierung Test (Zwei-Stichproben-T-Test)
- ROC-Kurven
- Spearman Rang Korrelation (Korrelationsmatrix, lineare Regression und Korrelation)
- Wilcoxon-Test (bei einer Stichprobe T-Test)
- Wilcoxon-Test (gepaarter t-Test)
Unternehmensforschung
- liniare Programmierung
Proportionen
- Ein Anteil
- Zwei Proportionen - Nichtunterlegenheit Tests
- Zwei Proportionen - Superiority Tests
- Zwei Proportionen - Gleichwertigkeit Tests
- Zwei Proportionen - zweiseitige Tests gegen einen Margin
- Zwei korrelierte Anteile (McNemar Test)
- Zwei korrelierte Proportionen - Nichtunterlegenheit Tests
- Zwei korrelierte Proportionen - Superiority Tests
- Zwei korrelierte Proportionen - Gleichwertigkeit Tests
- Kontingenztabellen (Kreuztabellen / Chi-Quadrat-Test)
- Frequenztabellen
- Cochran-Q-Test
- loglineare Modelle
- Mantel-Haenszel-Test
- ROC-Kurven
- Artikel-Analyse
- Item Response Analyse
- Binäre-Diagnostische-Tests - Einzelprobe
- Binäre-Diagnostische-Tests - Zwei unabhängige Stichproben
- Binäre-Diagnostische-Tests - gepaarte Stichproben
- Binäre-Diagnostische-Tests - Cluster Proben
Qualitätskontrolle
- X-Bar und R Charts
- X-Bar und s Charts
- X-Bar-Charts
- R-Charts
- s Charts
- CUSUM Charts
- Gleitender Durchschnitt
- EWMA Charts
- Einzelpersonen und Bewegungsbereich
- Levey-Jennings-Charts
- P Charts
- NP Charts
- C Charts
- U Charts
- Fähigkeitsanalyse
- R & R-Studie
- Toleranzintervalle
- Lag Plots
- Analyse der Versuche
- Pareto Charts
Regression
- Lineare Regression und Korrelation
- Box-Cox-Transformation für die einfache lineare Regression
- Deming-Regression
- Harmonic Regression
- Mixed Models - Random Koeffizienten
- Point-biserial und biserial Korrelationen
- Multiple Regression
- Multiple Regression mit seriellen Korrelation
- Nondetects Daten Regression
- Hauptkomponentenregression
- Response Surface Regression
- Ridge Regression
- Robust Regression
- Cox-Regression
- Parametric Überleben (Weibull) Regression
- Logistische Regression
- Diskriminanzanalyse
- Poisson Regression
- Probitanalyse
- Nichtlineare Regression
Regression (Variablenauswahl)
- Alle mögliche Regressionen
- schrittweise Regression
- Subset Selection in Multiple Regression
- Subset Selection in Multivariate Y Multiple Regression
- Cox-Regression
- Diskriminanzanalyse
- Logistische Regression
- Poisson Regression
Überleben/Zuverlässigkeit
- kumulative Inzidenz
- Kaplan-Meier-Kurven (Logrank Tests)
- Überlebenstabellen
- Cox-Regression
- Parametric Überlebens-(Weibull) Regression
- Beta Verteilungsanpassung
- Distribution-(Weibull) Fitting
- Gamma Verteilungsanpassung
- Mantel-Haenszel-Test
- Probitanalyse
- Zeit Kalkulator
- Toleranzintervalle
- Survival-Parameter-Konvertierungstool
- Überlebens-Plots
T-Tests
- eine Stichprobe T-Test
- Gepaarter t-Test
- Gepaarter t-Test für die Nichtunterlegenheit
- Gepaarter t-Test für die Gleichwertigkeit
- Zwei-Stichproben-T-Test
- Zwei-Stichproben-T-Test-von Means und SDs
- Box-Cox-Transformation für zwei oder mehr Gruppen (T-Test-und One-Way ANOVA)
- Test auf Nichtunterlegenheit mit zwei unabhängigen Proben
- Test auf Gleichwertigkeit mit zwei unabhängigen Proben
- Bland-Altman-Diagramm und Analyse
- Hotelling bei einer Stichprobe T2
- Hotelling Zwei-Stichproben T2
- Analyse von Zwei-Level-Designs
- Cross-Over Analyse mit T-Tests
Balkendiagramme
- Balkendiagramme (2 Faktoren)
- 3D-Balkendiagramme
- 3D-Balkendiagramme (2 Faktoren)
- Pareto Charts
Boxplots
- Boxplots
- Boxplots (2 Faktoren)
Circular Datenstücke
- Circular Datenanalyse (Rose Plots)
- Kreisdiagramme
Combo Charts
- Combo Charts
- Combo Charts (2 Faktoren)
Konturdiagramme
- Konturdiagramme
Kurvenanpassung
- Allgemeine Kurvenanpassung
- Michaelis-Menten-Gleichung
- Function Plots
- Streudiagramm-Matrix für die Kurvenanpassung
Dendrogramme
- Hierarchical Clustering (Dendrogramme)
Density Plots
- Density Plots
- Density Plots (2 Faktoren)
Punktdiagramme
- Punktdiagramme
- Punktdiagramme (2 Faktoren)
Fehlerbalkendiagramme
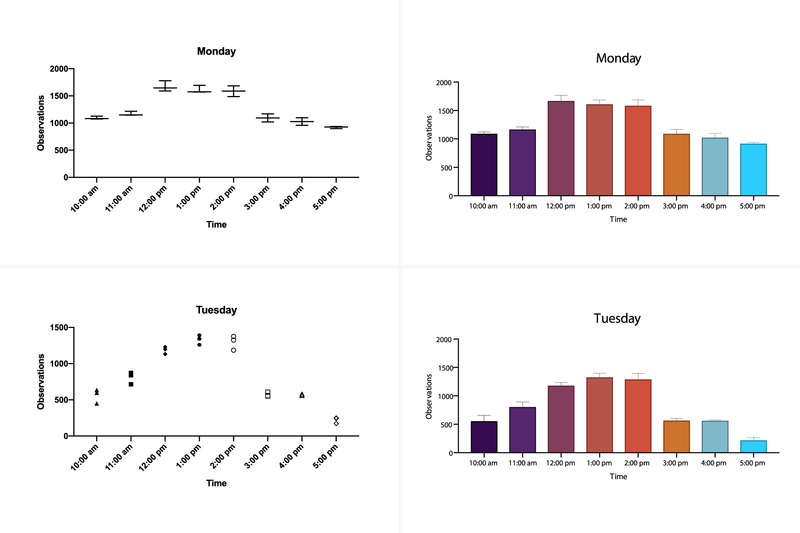
- Fehlerbalkendiagramme
- Fehlerbalkendiagramme (2 Faktoren)
Zeitreihen
- ARIMA (Box-Jenkins)
- automatische ARMA
- theoretische ARMA
- Autokorrelationen
- Kreuzkorrelationen
- Spektralanalyse
- Decomposition Forecasting
- Exponentielles Glätten - Horizontal
- Exponentielles Glätten - Trend
- Exponentielle Glättung - Trend / Saisonale
- Lag Plots
- Analyse der Versuche
Forest-Plots
- Meta-Analyse von Korrelierte Proportionen
- Meta-Analyse von Sterberaten
- Meta-Analyse von Means
- Meta-Analyse von Proportionen
Histogramme
- Histogramme
- vergleichende Histogramme
- Vergleichende Histogramme (2 Faktoren)
- Rose Plots
Liniendiagramme
- Liniendiagramme
- Liniendiagramme (2 Faktoren)
- 3D-Liniendiagramme
- 3D-Liniendiagramme (2 Faktoren)
Musaik-Plots
- Musaik-Plots
Perzentil-Plots
- Perzentil-Plots
- Perzentil-Plots (2 Faktoren)
Kreisdiagramme
- Kreisdiagramme
Wahrscheinlichkeitsdiagramme
- Normalverteilungsdiagramme
- Weibull Wahrscheinlichkeitsplots
- Logistische Normalverteilungsdiagramme
- Gamma Probability Plots
- Exponentielle Wahrscheinlichkeitsplots
- Chi-Quadrat Wahrscheinlichkeitsplots
- Uniform Probability Plots
- Halb-Normalverteilungsdiagramme
- Wahrscheinlichkeitsdiagramm Vergleich
Qualitätsregelkarten
- X-Bar und R Charts
- X-Bar und s Charts
- X-Bar-Charts
- R-Charts
- s Charts
- CUSUM Charts
- Gleitender Durchschnitt
- EWMA Charts
- Einzelpersonen und Bewegungsbereich
- Levey-Jennings-Charts
- P Charts
- NP Charts
- C Charts
- U Charts
- Fähigkeitsanalyse
- Lag Plots
- Analyse der Versuche
- Pa
- zreto Charts
ROC-Kurven
- ROC-Kurven
Streudiagramme
- Streudiagramme
- 3D-Streudiagramme
- Streudiagramm-Matrix
- Streudiagramm-Matrix für die Kurvenanpassung
- Lag Plots
Stamm-und-Blatt-Diagramme
- Stamm-and-Blatt-Diagramme
- Back-to-Back Stamm-und-Blatt-Diagramme
Oberflächen- und Konturdiagramme
- Konturdiagramme
- 3D Oberflächendiagramme
3D-Diagramme
- 3D-Streudiagramme
- 3D Oberflächendiagramme
- 3D-Balkendiagramme
- 3D-Balkendiagramme (2 Faktoren)
- 3D-Liniendiagramme
- 3D-Liniendiagramme (2 Faktoren)
Operations
- Datenfenster
- Importieren von Daten
- Exportieren von Daten
- Filter
- Transformationen
- Stapeln von Daten
- Entstapeln von Daten
- Erstellen von Kontrastvariablen
Verfahren
- Box-Cox-Transformation
- Box-Cox-Transformation für zwei oder mehr Gruppen (T-Test-und One-Way ANOVA)
- Box-Cox-Transformation für die einfache lineare Regression
- Datenliste
- Daten Screening
- Daten Simulation
- Zusammenführen von zwei Datensätze
- Datenabgleich - Greedy
- Datenabgleich - Optimal
- Daten Schichtung
- Time Calculator
Kalkulatoren
- Wahrscheinlichkeitsrechner
- Chi-Quadrat-Effect Size Kalkulator
- Odds Ratio und Proportionen Kalkulator
- Standardabweichung Kalkulator
- Survival-Parameter-Konvertierungstool
Neuerungen in NCSS
Neue Verfahren und Tests
- Bedingte logistische Regression
- Multiple Regression - Basic
- Negative Binomial Regression
- 'Zero-Inflated' Negative Binomial Regression
- 'Zero-Inflated' Poisson Regression
- Geometrische Regression
- Fraktionierte Polynomial Regression
- Passing-Bablok Regression für den Methodenvergleich
- Robuste Lineare Regression (Passing-Bablok Median-Slope)
- Logistische Regression (einschließlich Konfidenzintervall für AUC)
- Zweistufige Least Squares
- Streudiagramme mit Fehlerbalken
- Streudiagramme mit Fehlerbalken von Übersichtsdaten
- Fehlerbalkendiagramme von Übersichtsdaten
- Fehlerbalkendiagramme von Übersichtsdaten (2 Faktoren)
- Beschreibende Statistik - Übersichtstabellen
- Beschreibende Statistik - Übersichtslisten
- ROC-Kurve und Cutoff-Analyse
- Vergleich zweier ROC-Kurven - unabhängige Gruppen
- Vergleich zweier ROC-Kurven - abhängige Gruppen
- Analyse einer Einzelprobe eines binären Diagnosetests
- Korrelation
- Runddatenkorrelation
- Referenzintervalle
- Kosten-Nutzen-Analyse
- Verhältnisbewertung
- Hypride Bewertungsmodelle
- Multiple Regression für die Bewertung
- Stichproben für Attribute
- Kennlinien für Stichproben für Attribute
- Lineare Programmierung mit Begrenzung
- Gemischte-ganzzahlige Programmierung
- Quadtratische Programmierung
- Transport
- Zuordnung
- Kürzeste Strecke
- Maximaler Durchfluss
- Minimale Kosten
- Umschlag
- Dwass-Stahl-Critchlow-Fligner MC-Test (in der One-Way-Varianzanalyse)
Verbesserungen bestehender Features
- Datensimulationsverfahren
Die Datensimulationsverfahren wurden verbessert und bieten nun eine viel größere Auswahl an Distributionen. - One-Way ANOVA Residuen
Die einfaktorielle ANOVA ist nun in der Lage Residuen zu speichern. - Kontingenztabellen - Tabelleneintrag
Tabelleneinträge in Kontingenztabellen (Crosstabs / Chi-Quadtrat-Test) wurden verbessert. - Ein Anteil - Dateneingabe
Eine Datenbank-Dateneingabe-Option steht jetzt im 'Ein Anteil' Verfahren zur Verfügung. - Export Tool
Im Export Tool haben Sie jetzt die Möglichkeit, Variablen für den Export auszuwählen. - Output Titel
Software Versionen werden jetzt im Output hinterlegt. - Fehlerbalkendiagramme
Fehlerbalkendiagramme haben nun die Optionen Konfidenzintervall und Range. - Tabellenkalkulation - Bedienelemente
Die Bedienelemente wurden aktualisiert. - 3D-Diagramme
Die Anzeigegeschwindigkeit wurde verbessert und zusätzliche Verarbeitungsoptionen eingefügt. - Spaltenauswahlwerkzeuge
Erhebliche Verbesserungen wurden an den Spaltenauswahlwerkzeugen vorgenommen. - Automatische Skalierung von 'Ticks'
Die automatische Skalierung von 'Ticks' auf den numerischen Achsen eines Diagramms wurden verbessert. - Filter und 'Missing Values' in Zeitreihen und Prognosen
Filteroptionen und 'Missing Values' stehen nun in allen Zeitreihen und Prognosen zur Verfügung. - Menü - Verfahren
Das Verfahren-Menü wurde erweitert und sollte nun sehr viel intuitiver sein.