
The term industrial statistics refers to statistical methods used in the industrial manufacturing of products and/or for the definition and optimization of processes. Some of these methods follow a standardization others are defined industry-specific.
Tip

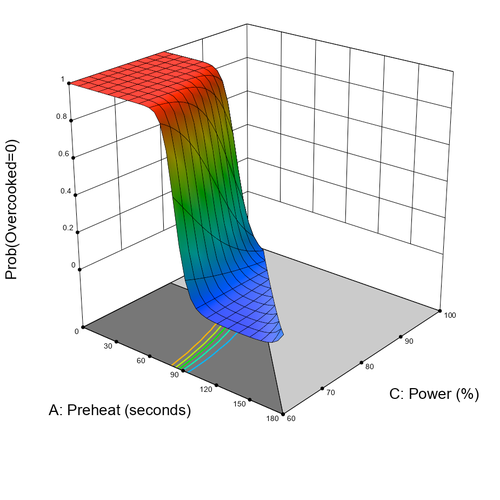
Design-Expert
Design-Expert® – The User-Friendly Software for Design of Experiments (DOE)
Design-Expert is a powerful design of experiments (DOE) software that combines an easy-to-use, intuitive interface with the latest techniques in multifactorial data analysis. The software guides you through all classic DOE phases: screening, optimization (RSM), and validation. With Design-Expert, you save time and costs in product development while improving process conditions.
Why Choose Design-Expert?
✅ Interactive 3D visualizations & contour plots – Quickly and easily identify optimization potential
✅ Versatile experimental designs – From classic designs to split-plot and mixture designs
✅ Multivariate optimization – Optimize multiple response variables simultaneously
✅ Excel export – Objective functions can be exported directly as formulas
✅ Propagation of error analysis – Find robust settings for your processes
Features of Design-Expert
📊 Rotatable 3D surface plots – Perfect for visualizing response surfaces
📊 Interactive contour & ternary plots – For precise process and formulation optimization
📊 All classic design types – Including D-optimal screening designs and I-optimal designs for RSM
📊 Definitive screening & split-plot designs – Ideal for hard-to-change factors
📊 Mixture & combined designs – Perfect for chemistry, pharmaceuticals, and formulation development
📊 Optimization platform with numerical optimization – Automatically calculates the best factor settings
Perfect for:
✔️ Research & Development
✔️ Chemical and pharmaceutical applications
✔️ Process optimization & quality control
✔️ Formulation & recipe development
Download Design-Expert® – Free Demo!
Try Design-Expert, the powerful DOE software, for free! The trial version is available for download on the Stat-Ease website.
🔹 Test all features – Experience the full power of screening, optimization (RSM), and validation
🔹 Intuitive user interface – Simple operation for fast results
🔹 Optimize formulations & processes – Ideal for research, development, and quality assurance
📥 Download your free demo now:
➡ Design-Expert Trial Version
Price on request

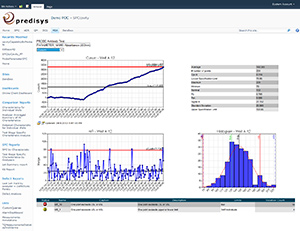
Predisys Analytical Suite
🏭 Predisys Analytical Suite® – Intelligent SPC Software for Industry 4.0
Predisys Analytical Suite is a scalable, browser-based solution for Statistical Process Control (SPC) and quality-related data analysis—purpose-built for the demands of Industry 4.0. The software enhances product quality, reduces operational costs, and delivers transparency and control across manufacturing processes.
✅ Why Choose Predisys?
🔧 Comprehensive SPC functionality – Control charts, process monitoring & root cause analysis
📈 Improved quality & cost-efficiency – Identify trends and deviations early
🌐 Fully browser-based – No local installation, ideal for IT teams & global collaboration
🧠 Industry 4.0 ready – Easily integrates with Lean, Six Sigma, TQM & digital manufacturing strategies
📊 For beginners & experts alike – Intuitive dashboards for plant managers, detailed analytics for quality engineers
💼 Built on Microsoft SharePoint – Scalable, secure, and enterprise-ready platform integration
🧩 Key Features of the Predisys Analytical Suite
🔹 Statistical Process Control (SPC):
• Multiple control chart types (X̄-R, p, np, u, c, etc.)
• Automated trend detection and deviation analysis
• Visual alerts & customizable control limits
🔹 Quality Data Analytics:
• Advanced statistical tools and analytics
• Monitor quality metrics over time and across product lines
• Integration with MES/ERP systems for automated data flow
🔹 Digitalization & Industry 4.0:
• Real-time, connected quality data across systems
• Support for IoT/sensor-driven production environments
• Ideal for Predictive Quality and Continuous Improvement initiatives
🔹 User-Friendly Interface:
• Role-based dashboards tailored for different user levels
• One-click export of reports & visualizations
• Granular permission settings and secure data access
🌍 Typical Use Cases
✔️ Automotive & suppliers
✔️ Mechanical & plant engineering
✔️ Electronics & microelectronics manufacturing
✔️ Plastics & metal processing
✔️ Aerospace & defense industries
✔️ Medical technology & high-tech production
💬 Conclusion: Predisys – SPC and Quality Intelligence for Connected Manufacturing
With Predisys Analytical Suite, organizations leverage a future-ready platform for quality monitoring, continuous improvement, and production intelligence. It combines the strengths of traditional SPC with modern Industry 4.0 integration—intuitive, powerful, and fully browser-based.
📥 Learn more or request a demo now:
➡ Visit the Predisys Product Page
Möchtest du auch eine Kurzversion für LinkedIn, ein Executive Summary für Entscheider oder eine Gegenüberstellung mit klassischen On-Premise-SPC-Systemen? Gib mir einfach Bescheid!
Price on request

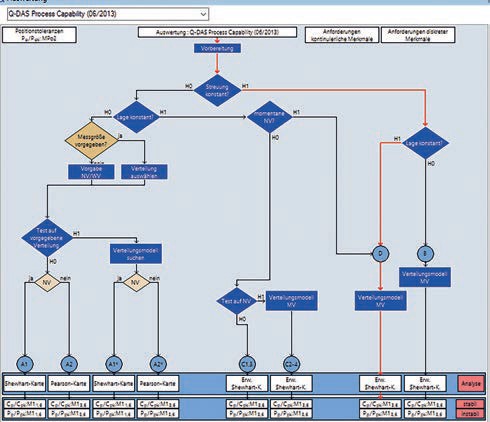
Qs-STAT
📊 Q-DAS qs-STAT® – Reliable Industrial Statistics for Quality Evaluation
Q-DAS qs-STAT® is the industry-established software solution for standardized and insightful statistical evaluations in manufacturing. It provides reliable quality metrics, supporting process-secure decision-making, continuous improvement, and globally comparable results.
✅ Why Choose qs-STAT?
📈 Validated statistical methods according to international standards
📏 Integrated norms & guidelines – e.g., DIN ISO 22514-2 and OEM-specific standards (BMW, Bosch, VW, GMPT, etc.)
🌍 Multilingual interface – optimized for global users
🧠 Automatic distribution analysis & process model assignment
🖥️ Intuitive visualizations – quickly identify critical process deviations
🔄 SAP integration (QM-STI) – use quality metrics & reports directly within your SAP system
🔒 Conformity declaration for compliant use in certified QM environments
🛠️ Key Features at a Glance
🔹 Statistical evaluation of manufacturing-relevant quality data
🔹 Automatic selection of the best-fitting distribution model
🔹 Assignment to appropriate process models (per ISO 22514-2)
🔹 Powerful filter and selection tools for targeted analysis
🔹 Customizable reports & dashboards for various user roles
🔹 Multilingual user interface – ideal for global manufacturing networks
🔹 Supports process and machine capability studies
📊 Clear Visual Insights – Instant Process Understanding
✔️ High-impact charts and graphs – including boxplots, trend charts, capability analyses
✔️ Highlighting of critical deviations – built-in visual alert systems
✔️ Clean, intuitive layouts – focus on exceptions and optimization opportunities
✔️ Direct derivation of corrective actions – fast, data-driven decisions
🔗 Seamless SAP Integration (QM-STI)
📎 If your inspection and measurement data is stored in SAP QM, qs-STAT can automatically analyze it. All metrics, charts, and reports are directly accessible in your SAP system – combining the strengths of both platforms for effective quality assurance.
🔒 Certified Suitability for Norm-Compliant Use
✔️ Meets key quality standards like ISO 9001, IATF 16949, and others
✔️ Verified suitability for initial and continuous deployment
📄 View Declaration of Suitability (PDF)
💬 Conclusion: qs-STAT – The Industrial Standard for Statistical Process Evaluation
Q-DAS qs-STAT is the go-to solution for companies requiring transparent, standardized, and globally understandable quality analysis – from shop floor to top floor, from local plants to global enterprises.
📥 Learn more or request a free demo now:
➡ Visit the Q-DAS product page: www.q-das.com
Price on request

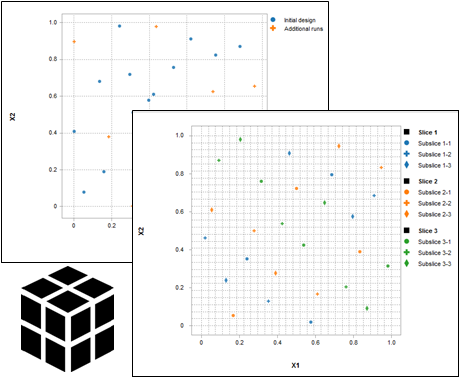
SmartUQ
🤖 SmartUQ – Powerful Machine Learning Software for Science & Engineering
SmartUQ is an advanced machine learning (ML) software solution purpose-built for scientific and engineering applications. Featuring high-precision ML models, an intuitive graphical interface, and powerful APIs, SmartUQ enables seamless development of predictive models, optimized sampling, uncertainty quantification, and model calibration.
✅ Why SmartUQ?
For manufacturers and engineering consultants, SmartUQ delivers industry-leading predictive modeling accuracy that helps streamline and optimize design and development processes.
Over recent years, SmartUQ has significantly expanded its scope to support a full range of AI and machine learning applications—empowering teams across the entire product lifecycle.
From early design exploration to simulation-based analysis, optimization, and quality assurance—SmartUQ is your intelligent companion for data-driven engineering.
🧠 Key Capabilities of SmartUQ
✔️ Design of Experiments (DOE) for Simulations
Efficient sampling strategies to collect the most informative data for model training.
✔️ Modeling & Emulation
Build high-precision surrogate models for simulation-based and experimental systems.
✔️ Sensitivity Analysis
Quantify the influence of input variables on system performance.
✔️ Model Calibration & Tuning
Refine your models by adjusting inputs to improve predictive accuracy.
✔️ Statistical Optimization & Adaptive Sampling
Boost design and operational efficiency through intelligent data acquisition.
✔️ Uncertainty Propagation & Risk Analysis
Incorporate uncertainty quantification to assess risks and build robust systems.
🎯 Conclusion: Smarter Engineering with SmartUQ
With SmartUQ, organizations gain access to a powerful, accurate, and flexible ML platform tailored for engineering simulation, design optimization, and AI-powered product development.
🚀 Take control of your modeling process and turn data into insight.
📥 Learn more and revolutionize your modeling & analytics with SmartUQ:
➡ Visit the official SmartUQ website
Price on request
SOSstat - Quality
🏭 SOSstat Quality® – Statistical Software for Industrial Quality Improvement
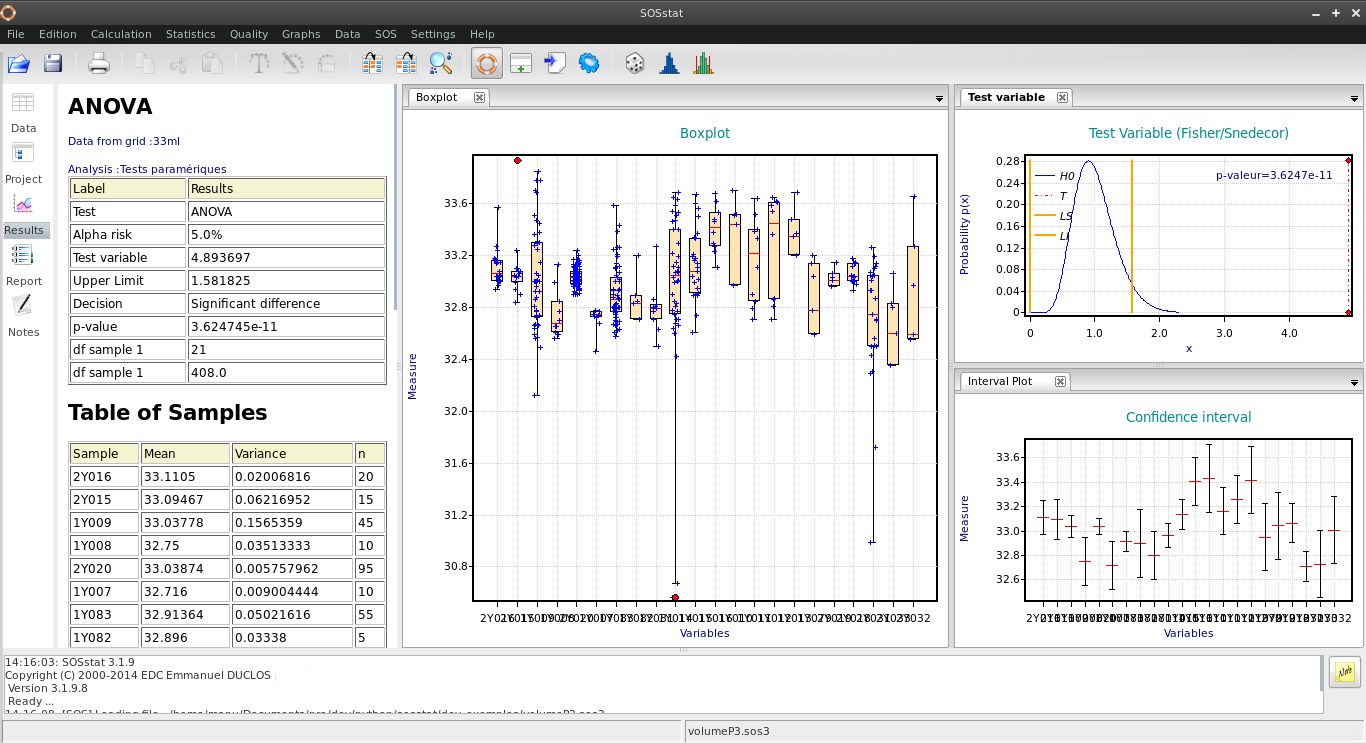
SOSstat Quality is a powerful software solution for statistical process control (SPC) and quality improvement in industrial environments. Specifically designed for engineers, technicians, and production teams, it combines ease of use with robust statistical tools, enabling quick and accurate analysis with minimal training.
✅ Why Choose SOSstat Quality?
🔍 Comprehensive statistical tools – For process analysis, monitoring, and optimization
📊 Modern visualizations & intuitive graphics – For fast, clear insights
🛠️ Built for industrial use – Ideal for manufacturing, quality management & validation
🚀 Integrated Six Sigma project management – Supports continuous improvement initiatives
🧠 Assistant-guided workflows – Designed for users with or without statistical expertise
🌐 Application Areas
✔️ Microelectronics & semiconductor industry
✔️ Aerospace & aviation
✔️ Mechanical & automotive engineering
✔️ Plastics & textile manufacturing
✔️ Medical devices & precision instruments
✔️ Quality management & regulatory validation
🧪 SOSstat VPAQ® – Simplifying Analytical Method Validation
SOSstat VPAQ is a specialized tool for the validation of quantitative analytical methods – ideal for industries where regulatory compliance and scientific precision are critical.
🎯 Designed for:
✔️ Chemical analysis
✔️ Pharmaceutical quality assurance
✔️ Food testing and laboratory analytics
With SOSstat VPAQ®, you can perform validations based on internationally recognized standards – accurately, efficiently, and in full compliance.
📐 Validation According to International Guidelines
📏 Total Error approach – Scientifically robust and easy to interpret
📘 Compliant with SFSTP & NF V 03-110
🌍 Aligned with ICH guidelines & ISO 5725
🔬 Scientifically validated & industry-proven – Trusted across sectors worldwide
🎯 Key Benefits at a Glance
🔒 Regulatory-compliant validation methodology
📈 Improved accuracy & reproducibility
📎 Demonstrable quality of products & processes
📂 Reliable documentation & integrated project tracking
💬 Conclusion: SOSstat – Quality at the Highest Level
Whether you're conducting a production analysis, leading a Six Sigma project, or performing method validation – SOSstat Quality® and SOSstat VPAQ® provide the essential tools to work efficiently, transparently, and in full compliance with industry standards.
📥 Learn more & request your free demo today!
➡ Contact us for product information or personal consultation.
Price on request
Tip

Stat-Ease 360
🚀 Stat-Ease 360® – The Next Generation of Design of Experiments (DoE) Software
Stat-Ease 360 is the most advanced statistical software from the makers of Design-Expert®, offering a powerful extension to the renowned DoE platform. Built for engineers, scientists, and analysts, Stat-Ease 360 delivers cutting-edge tools for design of experiments, data analysis, and automation – all within a user-friendly interface.
✅ Why Choose Stat-Ease 360?
✔ Includes all features of Design-Expert® – and more
✔ Seamless Python integration for automation, scripting, and database connectivity
✔ Enhanced DoE tools for simulation-based experiments
✔ Supports Gaussian Process Models, Latin Hypercubes, and model-based optimal designs
✔ Maintains the intuitive user interface of Design-Expert®
Whether you're optimizing physical experiments or running computational simulations, Stat-Ease 360 (SE360) provides the tools to boost precision, reduce resource usage, and streamline your workflow.
🔍 New Features in Stat-Ease 360
🔹 Logistic Regression with ROC Curves
Perform advanced classification analyses with visual ROC curve output for clear, data-driven decision-making.
🔹 Simulation-Optimized Designs
Leverage space-filling designs and modern modeling techniques for accurate computer-based experiments.
🔹 Gaussian Process Modeling
Incorporate powerful surrogate modeling tools to better interpret and optimize simulation responses.
🔹 Latin Hypercube Sampling (LHS)
Create space-filling designs that efficiently explore the input space of complex models.
🔹 Python Scripting Integration
Automate data analysis, connect to external databases, and expand your capabilities with Python libraries and APIs.
👨🔬 Designed for Advanced Experimental Analysis
Stat-Ease 360 is ideal for:
Engineers & Researchers working on simulation and optimization
Data Scientists integrating experimental models into Python workflows
Product Developers needing faster, smarter insights
Six Sigma, R&D, and Quality Teams aiming for data-driven decision-making
🎯 Key Benefits
✅ Full compatibility with Design-Expert® projects
✅ Enhanced tools for simulation, modeling & machine learning workflows
✅ Scalable from small lab tests to high-performance simulations
✅ Modern statistical features with an intuitive interface
📥 Try Stat-Ease 360 for Free!
Discover how SE360 can transform your DoE workflows and simulation strategies.
➡ Download the free trial and experience the future of experimental design:
👉 Trial-version
Price on request

Visual-XSel
Visual-XSel: Easy Application of Powerful Methods for Reliability Analysis, Weibull Analysis, and Design of Experiments
Visual-XSel is a user-friendly software that offers a variety of powerful methods for reliability analysis, Weibull analysis, and design of experiments (DOE). With Visual-XSel, users can easily apply complex statistical methods without requiring deep prior knowledge. Our goal is to make complex analytical processes accessible while ensuring the correct interpretation of results.
Reliability Analysis with Visual-XSel
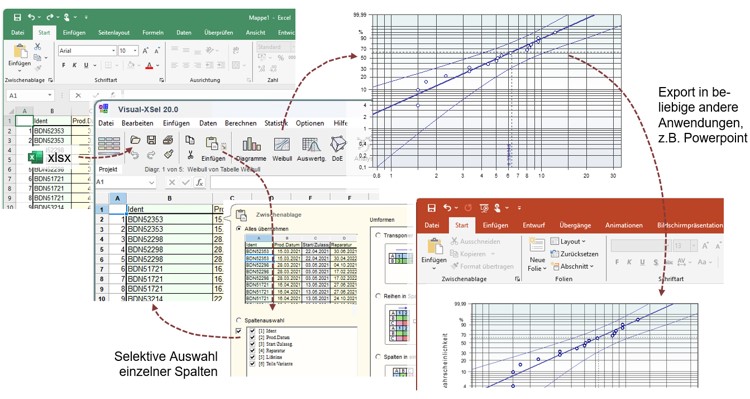
Visual-XSel offers comprehensive features for reliability analysis, allowing users to evaluate the lifetime and failure probability of products or systems. With powerful algorithms, users can accurately determine reliability metrics and easily visualize the results in clear, informative charts.
Weibull Analysis Made Easy
Weibull analysis is one of the most important methods for analyzing the lifespan of products. Visual-XSel provides an intuitive user interface that allows users to quickly determine Weibull parameters and accurately visualize the results. The software guides users through the entire analysis process and provides valuable expert tips for interpreting the results correctly.
Efficient Design of Experiments and Analysis
Visual-XSel also simplifies design of experiments (DOE) by providing an easy-to-use interface that enables users to create, simulate, and analyze experiment designs. This allows you to find the optimal experimental setup for your tests and analyze the results effectively.
Step-by-Step Guidance and Expert Knowledge
The software leads users through the analysis procedures step-by-step and ensures that even complex data is interpreted correctly. With the help of tooltips and interactive instructions, users receive expert advice for interpreting the results at every stage of the process.
Why Visual-XSel?
Ease of Use: Visual-XSel makes reliability analysis and Weibull analysis easy and accessible.
Step-by-Step Guidance: Users are guided through the entire analysis process.
Expert Knowledge: Built-in tips help ensure correct interpretation of results.
Powerful Methods: Leverage proven analysis techniques that are easy to apply.
Conclusion
With Visual-XSel, users can easily perform powerful analytical methods such as Weibull analysis, reliability analysis, and design of experiments without having to rely on complex software solutions.
Price on request