Product information "Visual-XSel"
Visual-XSel: Easy Application of Powerful Methods for Reliability Analysis, Weibull Analysis, and Design of Experiments
Visual-XSel is a user-friendly software that offers a variety of powerful methods for reliability analysis, Weibull analysis, and design of experiments (DOE). With Visual-XSel, users can easily apply complex statistical methods without requiring deep prior knowledge. Our goal is to make complex analytical processes accessible while ensuring the correct interpretation of results.
Reliability Analysis with Visual-XSel
Visual-XSel offers comprehensive features for reliability analysis, allowing users to evaluate the lifetime and failure probability of products or systems. With powerful algorithms, users can accurately determine reliability metrics and easily visualize the results in clear, informative charts.
Weibull Analysis Made Easy
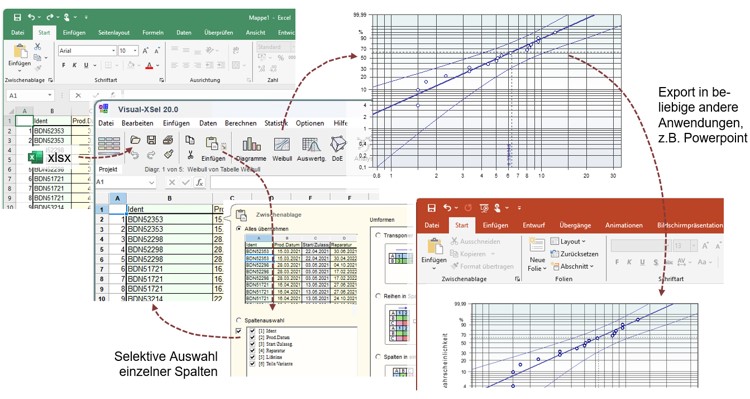
Weibull analysis is one of the most important methods for analyzing the lifespan of products. Visual-XSel provides an intuitive user interface that allows users to quickly determine Weibull parameters and accurately visualize the results. The software guides users through the entire analysis process and provides valuable expert tips for interpreting the results correctly.
Efficient Design of Experiments and Analysis
Visual-XSel also simplifies design of experiments (DOE) by providing an easy-to-use interface that enables users to create, simulate, and analyze experiment designs. This allows you to find the optimal experimental setup for your tests and analyze the results effectively.
Step-by-Step Guidance and Expert Knowledge
The software leads users through the analysis procedures step-by-step and ensures that even complex data is interpreted correctly. With the help of tooltips and interactive instructions, users receive expert advice for interpreting the results at every stage of the process.
Why Visual-XSel?
- Ease of Use: Visual-XSel makes reliability analysis and Weibull analysis easy and accessible.
- Step-by-Step Guidance: Users are guided through the entire analysis process.
- Expert Knowledge: Built-in tips help ensure correct interpretation of results.
- Powerful Methods: Leverage proven analysis techniques that are easy to apply.
Conclusion
With Visual-XSel, users can easily perform powerful analytical methods such as Weibull analysis, reliability analysis, and design of experiments without having to rely on complex software solutions.
Visual-XSel – Powerful Software for Statistics, Reliability Analysis & Design of Experiments (DoE)
Advanced Statistical Analysis & Visualization at the Highest Level
Visual-XSel is a comprehensive statistical software solution designed specifically for graphical data analysis, reliability methods, and Design of Experiments (DoE). With powerful templates, open algorithms, and an intuitive user interface, Visual-XSel offers a unique blend of flexibility and precision.
🔍 Core Features of Visual-XSel
🔹 General Statistics & Data Analysis
✔ Enhanced boxplots with extended visualization options
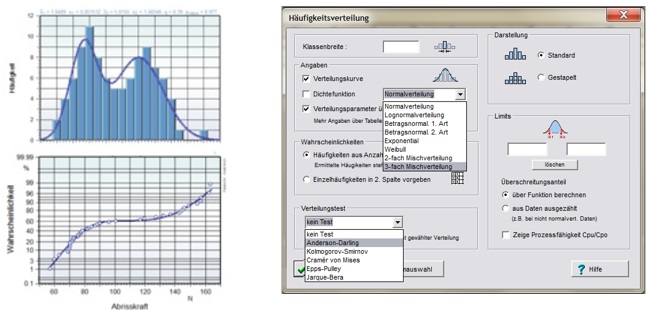
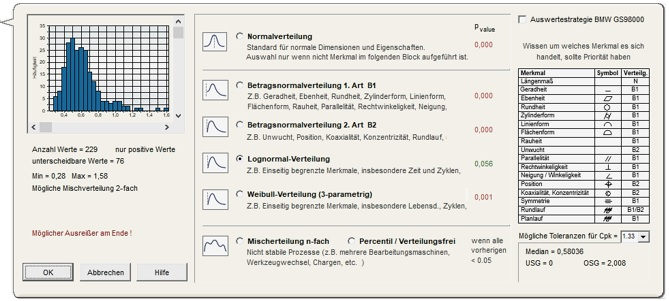
✔ Automatic normality tests
✔ Hypothesis testing & probability calculations
✔ Measurement system analysis (MSA) according to VDA 5 & ISO 22514-7
✔ Customizable templates with integrated flowcharts
🔹 Reliability Methods & Weibull Analysis
✔ 3-parameter Weibull distribution with optional range reduction
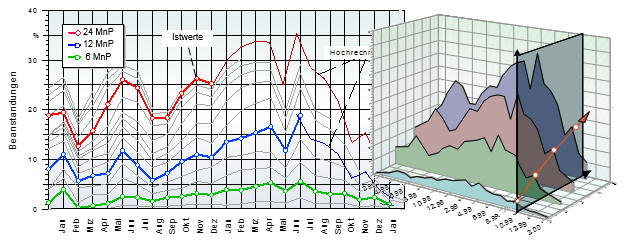
✔ Forecasting for censored data with auto-fitting function
✔ Field data evaluation & Pareto analysis for root cause detection
✔ Double-exponential functions for accurate long-term forecasting
✔ Weibull & Lognormal analysis based on BMW Group Standard GS97055
✔ Sample size calculation for reliability proof
✔ Monte Carlo simulation & Fault Tree Analysis (FTA)
✔ Graphical system analysis for lifetime-relevant components
🔹 Design of Experiments (DoE)
✔ Full range of experimental designs with up to 13 categorical factors
✔ D-optimal designs & Definitive Screening Designs (DSD)
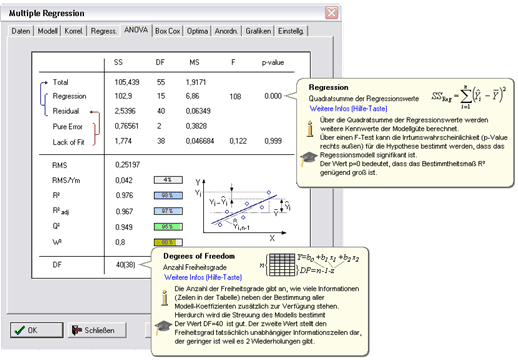
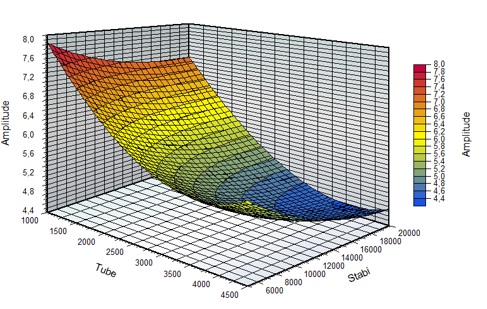
✔ Multiple regression with up to 120 parameters and 3-way interactions
✔ Built-in optimizer for best parameter settings & automatic model creation
✔ Partial Least Squares (PLS) tool for analyzing correlated data
✔ Import/export DoE data from external applications
✔ Expert guide with tooltips for easy interpretation
✔ Graphical mind maps for systematic experiment planning
🔹 Measurement & Process Analysis
✔ MSA Types 1, 2 & 3 (VDA 5, MSA4 – Gage R&R)
✔ Discrete MSA (Gage R&R, Ordinal-Kendall, Fleiss’ Kappa)
✔ Machine & process capability analysis for various distributions
✔ Control charts & pre-control analysis
✔ Automatic distribution fitting for optimal process evaluation
✔ Tolerance calculation for achieving required Cpk values
✅ Why Choose Visual-XSel?
-
Extensive tools for statistical and reliability analysis – ideal for industry & research
-
Flexible, customizable templates – Open algorithms for company-specific solutions
-
Compliant with automotive standards (VDA, BMW, IEC 61164)
-
Optimized DoE tools – Identify critical parameters and build precise models
-
Maximum efficiency – Auto-reporting, scenario analysis & intuitive user experience
📌 Learn more on the official Visual-XSel website and experience the next level of statistical engineering.


