Skip to main content Skip to search Skip to main navigation
Menu

Stat/Transfer

Licensing options Stat Transfer: Single User yearly | Usage Type: Academic
Stat/Transfer simplifies the file transferring of statistical data between different statistical software programs. The data are converted without loss of information between different file formats.
Description

Product information "Stat/Transfer"

๐Ÿ“Š Stat/Transferยฎ โ€“ Fast and Reliable Data Conversion Software for Statistics

Stat/Transfer is the powerful solution for transferring data between virtually all major statistical software packages. Known for its speed, accuracy, and ease of use, Stat/Transfer is ideal for data analysts, researchers, and anyone working with large datasets.


โœ… Why Choose Stat/Transfer?

  • โšก Lightning-fast data conversion โ€“ Save hours of manual effort

  • ๐Ÿ”’ Accurate and lossless transformation โ€“ Preserve all metadata, including labels and missing values

  • ๐Ÿ–ฑ๏ธ User-friendly interface โ€“ No programming skills required

  • ๐Ÿ”ง Highly customizable โ€“ Select variables, cases, and formats with precision

  • ๐Ÿ” Reproducible results โ€“ Use automatic logs and reusable transfer scripts


๐Ÿงฐ Key Features

  • โœ… Supports 40+ file formats โ€“ Seamless transfer across Excel, SPSS, Stata, R, SAS & more

  • โœ… Optimized presets โ€“ Smart default settings for each format ensure smooth workflows

  • โœ… One-click conversions โ€“ No need for complex setup or configuration

  • โœ… Full metadata retention โ€“ Keep variable labels, formats, missing values, and more

  • โœ… Automated script generation โ€“ Run repeat transfers with ease and consistency

  • โœ… Cross-platform compatibility โ€“ Works on Windows and macOS


๐Ÿ”— Supported Formats (Selection)

โœ”๏ธ Excel, CSV, ASCII (delimited & fixed-width)
โœ”๏ธ SPSS (.sav), Stata, SAS (value labels & transport files)
โœ”๏ธ R, S-PLUS, JMP, Minitab, Matlab, EViews
โœ”๏ธ Access, dBASE, FoxPro, Paradox
โœ”๏ธ OpenDocument Spreadsheets, HTML Tables, Triple-S, OSIRIS
...and many more!


๐Ÿ‘ฉโ€๐Ÿ’ป Perfect For:

  • ๐Ÿ”ฌ Data Analysis & Statistical Research

  • ๐ŸŽ“ Academic & Scientific Work

  • ๐Ÿ“Š Business Intelligence & Reporting

  • ๐Ÿฅ Healthcare, Market & Social Research

  • ๐Ÿค Multi-tool Teams with Diverse Software Stacks


๐Ÿš€ Try Stat/Transfer Now!

Discover how fast and easy data conversion can be.

๐Ÿ“ฅ Download the free trial
Try Stat/Transfer with full functionality directly from the official website.

โžก Learn more at Stat/Transfer Website


Details

๐Ÿš€ Stat/Transfer โ€“ Now with More Power, Formats & Features!

Stat/Transfer remains the leading choice for lightning-fast and precise data conversionโ€”now upgraded with more supported formats, new features, and expanded platform compatibility.


๐Ÿ†• Newly Supported Data Formats

โœ… Feather โ€“ Ultra-fast data exchange format for R & Python
โœ… Minitab Project Files (Read) โ€“ Seamless import of full projects
โœ… R Tables & R v3+ Files (Read) โ€“ Faster access to modern R file structures
โœ… R Compressed Binary Write โ€“ Space-saving, highly compatible output
โœ… Stata Version 16 โ€“ Including Unicode and higher observation limits
โœ… BayesiaLab (Write-only) & JSON-Stat (Read-only)
โœ… Enhanced support for Stata MP, SAS, and ASCII schemas


๐Ÿ Now macOS Catalina Compatible

  • Fully certified for macOS Catalina and beyond

  • 64-bit support and Apple notarization included
    โ— Note: Versions prior to v15 are not fully Catalina-compatible.


๐Ÿ”„ New Production Licensing Available

๐Ÿ’ผ Production License now available for:
โœ” Web servers
โœ” SaaS applications
โœ” Batch processing environments

โžก Perfect for enterprise automation and high-volume workflows
๐Ÿ“ฉ Contact our sales team for custom licensing options.


๐Ÿ”ง More Enhancements & Productivity Features

๐Ÿ“‚ Cross-directory transfers โ€“ Use wildcards and automate multi-file operations
๐Ÿ“‘ More control over variable order, names, types, and labels
๐Ÿงฉ Extended metadata support for R, SAS, JMP, and Stata
๐Ÿ“… Full control over date/time formats during SAS exports
๐Ÿ—‚๏ธ Add value labels to Excel and ASCII exports
๐Ÿ“Š Faster R imports โ€“ Noticeable performance boost
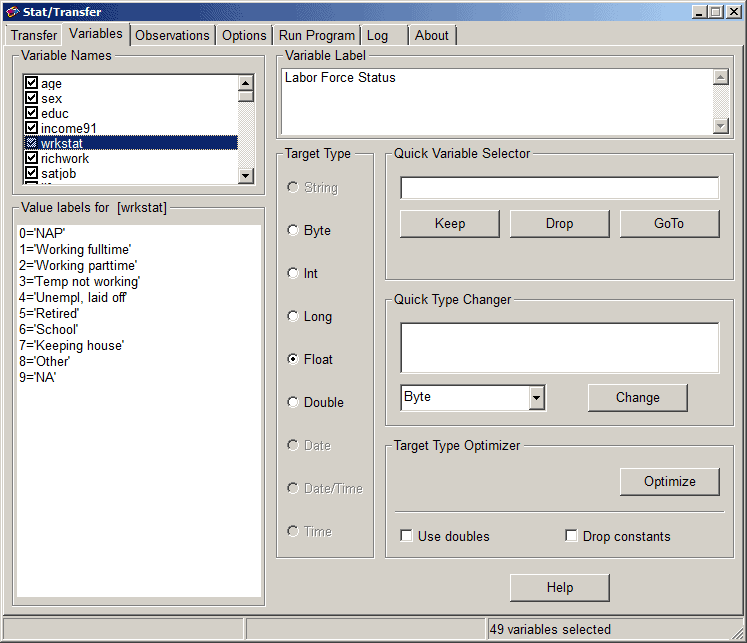
๐Ÿง  New tools: Quick Variable Selector & Quick Type Changer


๐Ÿ“ˆ Support for Even Larger Files

  • Excel files over 4 GB

  • SAS/Stata files with more than 32,000 variables

  • dBASE files exceeding 2 GB


๐Ÿ–ฅ๏ธ Redesigned Interface & Workflow Screens

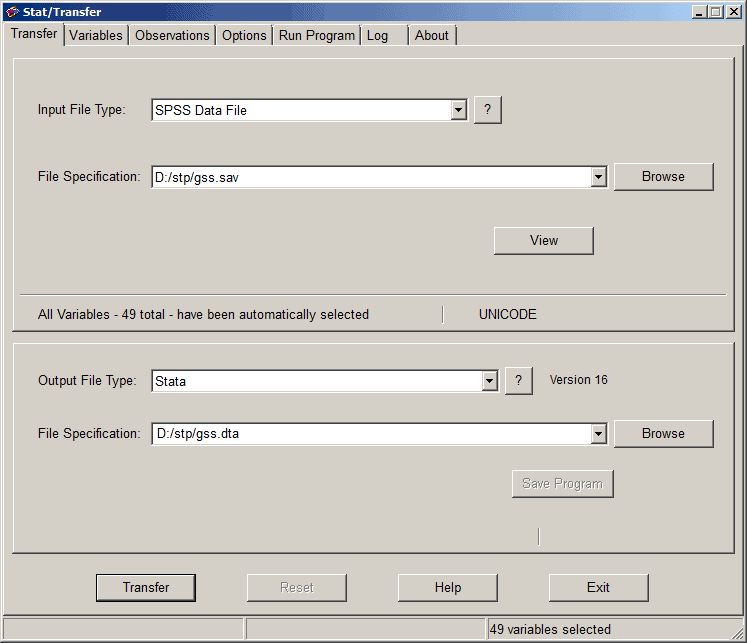
๐ŸŸฆ Transfer Screen โ€“ Convert data in just a few clicks
๐ŸŸฉ Variable Screen โ€“ Select, filter & assign target types with ease
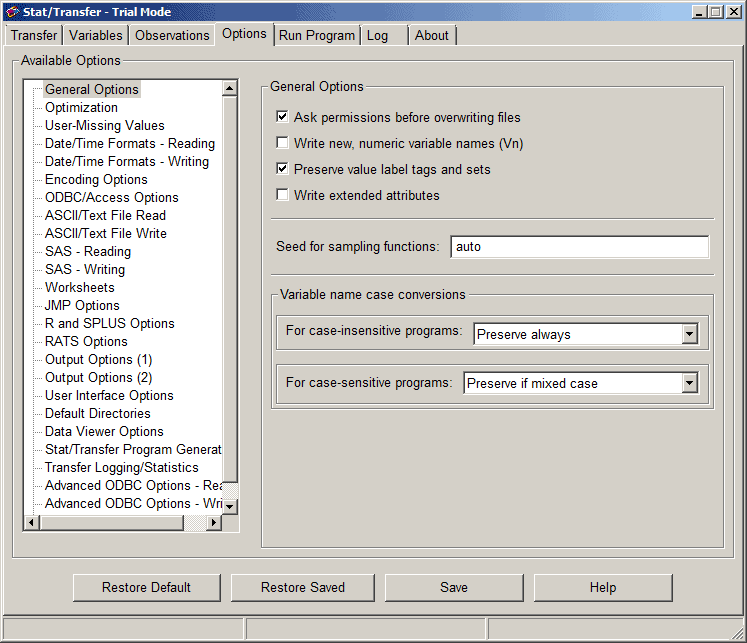
๐ŸŸจ Options Screen โ€“ Tune settings by category
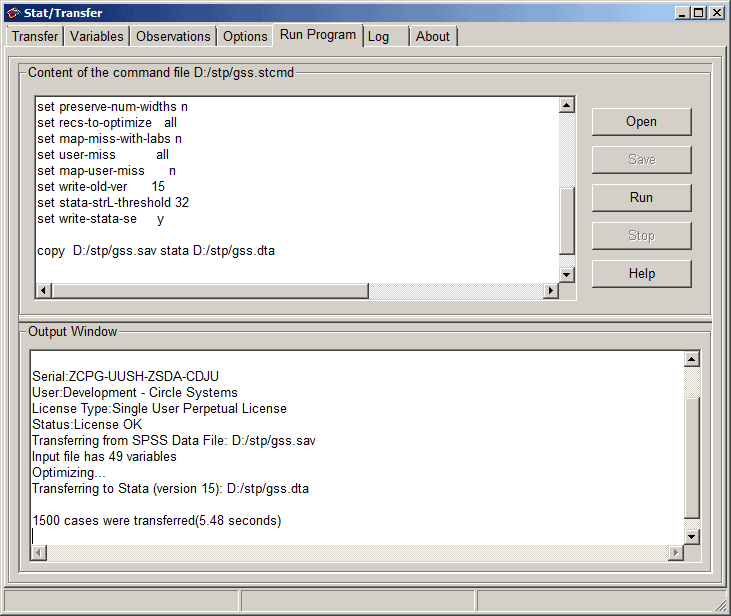
๐ŸŸง Run Program Screen โ€“ Load, save & run scripts directly
๐ŸŸฅ Log Screen โ€“ Complete audit trail and error logging


๐Ÿ’ป Command Processor for Power Users

โœ๏ธ Use simple syntax for complex conversions
๐Ÿ“ Automate multi-file transfers with wildcards
๐Ÿงฉ Integrate with batch, Shell, or DOS scripts
๐Ÿ”„ Configure ODBC for database workflows


โœ… Summary: More Flexible, Faster, and More Powerful Than Ever

Whether you're converting a single file or managing automated batch processes, Stat/Transfer 13+ delivers unmatched versatility and speed in statistical data conversion.

โœ… More formats
โœ… More features
โœ… More control
โœ… Seamless platform integration


๐Ÿ“ฅ Try it now and experience the new version:
โžก Download the free demo on the official Stat/Transfer website

Requirements

ย WindowsยฎMacLinuxSolaris
Andere VoraussetzungenMinimum 1024*786 DisplayMinimum 1024*786 DisplayMinimum 1024*786 Displayย 
BetriebssystemXP, Vista oder Windows 7/8/10 (64 oder 32 Bit)Apple Mac OS-X 10.4 (Tiger), 10.5 (Leopard), 10.6 (Snow Leopard), 10.7 (Lion), 10.8 (Mountain Lion - S/T V12 only), 10.9 (Mavericks - ST V12 and above) und macOS Sierra und hรถher
  • 32 oder 64 bit
  • Kernel 2.6 oder hรถher
  • glibc 2.3.3 oder hรถher
  • gtk 2.6.4 oder hรถher
Solaris 10 oder hรถher
Minimum CPUIntel oder AMD x86 ProzessorIntel oder PowerPC ProzessorIntel oder AMD x86 ProzessorIntel oder SPARC Prozessor
Min. RAM512 MB512 MB512 MBย 
Festplattenplatz25 MB20 MB20 MBย 
Skip product gallery

Recommended

Tip
Stat-Ease 360
๐Ÿš€ Stat-Ease 360ยฎ โ€“ The Next Generation of Design of Experiments (DoE) Software Stat-Ease 360 is the most advanced statistical software from the makers of Design-Expertยฎ, offering a powerful extension to the renowned DoE platform. Built for engineers, scientists, and analysts, Stat-Ease 360 delivers cutting-edge tools for design of experiments, data analysis, and automation โ€“ all within a user-friendly interface. โœ… Why Choose Stat-Ease 360? โœ” Includes all features of Design-Expertยฎ โ€“ and more โœ” Seamless Python integration for automation, scripting, and database connectivity โœ” Enhanced DoE tools for simulation-based experiments โœ” Supports Gaussian Process Models, Latin Hypercubes, and model-based optimal designs โœ” Maintains the intuitive user interface of Design-Expertยฎ Whether you're optimizing physical experiments or running computational simulations, Stat-Ease 360 (SE360) provides the tools to boost precision, reduce resource usage, and streamline your workflow. ๐Ÿ” New Features in Stat-Ease 360 ๐Ÿ”น Logistic Regression with ROC Curves Perform advanced classification analyses with visual ROC curve output for clear, data-driven decision-making. ๐Ÿ”น Simulation-Optimized Designs Leverage space-filling designs and modern modeling techniques for accurate computer-based experiments. ๐Ÿ”น Gaussian Process Modeling Incorporate powerful surrogate modeling tools to better interpret and optimize simulation responses. ๐Ÿ”น Latin Hypercube Sampling (LHS) Create space-filling designs that efficiently explore the input space of complex models. ๐Ÿ”น Python Scripting Integration Automate data analysis, connect to external databases, and expand your capabilities with Python libraries and APIs. ๐Ÿ‘จโ€๐Ÿ”ฌ Designed for Advanced Experimental Analysis Stat-Ease 360 is ideal for: Engineers & Researchers working on simulation and optimization Data Scientists integrating experimental models into Python workflows Product Developers needing faster, smarter insights Six Sigma, R&D, and Quality Teams aiming for data-driven decision-making ๐ŸŽฏ Key Benefits โœ… Full compatibility with Design-Expertยฎ projects โœ… Enhanced tools for simulation, modeling & machine learning workflows โœ… Scalable from small lab tests to high-performance simulations โœ… Modern statistical features with an intuitive interface ๐Ÿ“ฅ Try Stat-Ease 360 for Free! Discover how SE360 can transform your DoE workflows and simulation strategies. โžก Download the free trial and experience the future of experimental design: ๐Ÿ‘‰ย Trial-version

Price on request
Stat/Transfer
๐Ÿ“Š Stat/Transferยฎ โ€“ Fast and Reliable Data Conversion Software for Statistics Stat/Transfer is the powerful solution for transferring data between virtually all major statistical software packages. Known for its speed, accuracy, and ease of use, Stat/Transfer is ideal for data analysts, researchers, and anyone working with large datasets. โœ… Why Choose Stat/Transfer? โšก Lightning-fast data conversion โ€“ Save hours of manual effort ๐Ÿ”’ Accurate and lossless transformation โ€“ Preserve all metadata, including labels and missing values ๐Ÿ–ฑ๏ธ User-friendly interface โ€“ No programming skills required ๐Ÿ”ง Highly customizable โ€“ Select variables, cases, and formats with precision ๐Ÿ” Reproducible results โ€“ Use automatic logs and reusable transfer scripts ๐Ÿงฐ Key Features โœ… Supports 40+ file formats โ€“ Seamless transfer across Excel, SPSS, Stata, R, SAS & more โœ… Optimized presets โ€“ Smart default settings for each format ensure smooth workflows โœ… One-click conversions โ€“ No need for complex setup or configuration โœ… Full metadata retention โ€“ Keep variable labels, formats, missing values, and more โœ… Automated script generation โ€“ Run repeat transfers with ease and consistency โœ… Cross-platform compatibility โ€“ Works on Windows and macOS ๐Ÿ”— Supported Formats (Selection) โœ”๏ธ Excel, CSV, ASCII (delimited & fixed-width) โœ”๏ธ SPSS (.sav), Stata, SAS (value labels & transport files) โœ”๏ธ R, S-PLUS, JMP, Minitab, Matlab, EViews โœ”๏ธ Access, dBASE, FoxPro, Paradox โœ”๏ธ OpenDocument Spreadsheets, HTML Tables, Triple-S, OSIRIS ...and many more! ๐Ÿ‘ฉโ€๐Ÿ’ป Perfect For: ๐Ÿ”ฌ Data Analysis & Statistical Research ๐ŸŽ“ Academic & Scientific Work ๐Ÿ“Š Business Intelligence & Reporting ๐Ÿฅ Healthcare, Market & Social Research ๐Ÿค Multi-tool Teams with Diverse Software Stacks ๐Ÿš€ Try Stat/Transfer Now! Discover how fast and easy data conversion can be. ๐Ÿ“ฅ Download the free trial Try Stat/Transfer with full functionality directly from the official website. โžก Learn more at Stat/Transfer Website

Price on request
Stata
๐Ÿงฎ Stata โ€“ The Powerful Statistical Software for Precise Data Analysis Stata is a versatile and robust software solution renowned for its exceptional capabilities in time-based data analysis. With Stata, you can model everything from simple time series (e.g., ARIMA) to complex multivariate models such as VAR and VEC. It also supports GARCH models for volatility analysis and Kaplan-Meier estimators for survival analysis. For deep panel data insights, Stata offers powerful tools for mixed-effects modeling. One of Stata's greatest strengths lies in its intuitive yet powerful programming language, which allows you to automate workflows and create custom statistical procedures with ease. ๐Ÿ“Š Comprehensive Statistical Methods for Every Application Stata covers the full range of classical statistical techniquesโ€”and much more. You can calculate descriptive statistics, run hypothesis tests (e.g., mean comparisons, normality testsโ€”both parametric and non-parametric), and visualize your results in high-quality scientific graphs. As a complete statistical package, Stata is ideal for research and development across disciplines. Researchers in sociology, economics, political science, epidemiology, and medical sciences especially benefit from Stataโ€™s broad and high-quality suite of analytical tools. ๐Ÿš€ Why Choose Stata? โœ… Optimized for research & development โ€“ Designed for complex data analysis and statistical evaluation โœ… Extensive features โ€“ A wide array of statistical and graphical capabilities, including publication-ready charts โœ… Flexibility โ€“ Exceptional for analyzing time-series data, volatility, and panel data โœ… Powerful yet user-friendly โ€“ Stataโ€™s integrated programming language enables efficient automation of complex workflows ๐ŸŽฏ Stata Editions to Meet Your Needs Whether you're a student or a senior researcher, Stata has a version tailored to your work: Stata/BE (Basic Edition) Stata/SE (Standard Edition) Stata/MP (Multiprocessor Edition) Choose the edition that fits your dataset size and analysis complexity. ๐Ÿฅ Stata for Clinical Research and Medical Statistics Stata is also a top-tier solution for clinical research and medical studies. It offers specialized tools for method validation, biostatistics, and regulatory-compliant data analysis, making it the ideal platform for precise, reliable, and reproducible results in clinical environments. ๐Ÿ“ˆ Conclusion: Stata empowers researchers and analysts with the tools to handle complex data and gain deeper insightsโ€”efficiently, accurately, and intuitively. ๐Ÿ“ฅ Learn more or try Stata today on the official Stata website.

Price on request
GraphPad Prism
GraphPad Prism โ€“ The Leading Software for Data Analysis & Scientific Visualization GraphPad Prism is the preferred statistics and graphing software designed specifically for scientific research. Researchers around the world use Prism to perform accurate data analysis, make informed statistical decisions, and present results in professional, publication-ready charts. ๐Ÿš€ Save time and improve the accuracy of your analyses with GraphPad Prism! Biostatistics & Data Analysis for Life Sciences Originally developed for biology, medicine, and pharmacology, GraphPad Prism is now widely used across the life sciencesโ€”from students and PhD researchers to scientists in the pharmaceutical and healthcare industries. โœ… Easy-to-use statistical analysis tools for scientists โœ… Automated graphing for accurate data visualization โœ… Clear, easy-to-understand results interpretation ๐Ÿ“Œ No other software offers such intuitive and powerful curve fitting! Powerful Statistical Tools in GraphPad Prism GraphPad Prism includes a wide range of statistical tests and regression models to help you analyze your research data precisely and confidently. Included Statistical Methods: ๐Ÿ“Š t-tests (unpaired & paired) ๐Ÿ“Š ANOVA (one-way, two-way, three-way) ๐Ÿ“Š Nonparametric tests ๐Ÿ“Š Linear & nonlinear regression ๐Ÿ“Š Survival analysis (Kaplan-Meier) ๐Ÿ“Š Contingency table analysis ๐Ÿ’ก Especially for nonlinear regression, Prism offers advanced tools to calculate EC50, fit complex models, and compare curves with ease. Scientific Graphing with Flexible Chart Customization With GraphPad Prism, you can create high-quality scientific graphs that update automatically when your data changes. ๐ŸŽจ Graphing Highlights: โœ… Automatically generated graphs based on your analyses โœ… Fully customizable axes, colors, labels, and layouts โœ… One-click templates for professional, consistent output ๐Ÿ“ˆ Create perfect scientific visuals in just a few clicks! Why Choose GraphPad Prism? ๐Ÿ”น Fast & easy data analysis for scientists ๐Ÿ”น Automated statistics and charting for accurate research ๐Ÿ”น Comprehensive tools for biostatistics & nonlinear regression ๐Ÿ”น Intuitive interface โ€“ perfect for students and professionals alike ๐Ÿš€ Get started with GraphPad Prism and take your scientific research to the next level! ๐Ÿ“ฅ Download your free trial now: โžก Learn more & get the free trial

Price on request