The field of life science includes statistical methods in the areas of medicine, biology, pharmacy and biotech. In addition to classical statistical methods such as hypothesis testing, linear regression analysis and descriptive methods, specialized analyses are also required. Survival time analysis, non-linear regression such as dose-response or kinetics curves.
GraphPad Prism
GraphPad Prism – The Leading Software for Data Analysis & Scientific Visualization
GraphPad Prism is the preferred statistics and graphing software designed specifically for scientific research. Researchers around the world use Prism to perform accurate data analysis, make informed statistical decisions, and present results in professional, publication-ready charts.
🚀 Save time and improve the accuracy of your analyses with GraphPad Prism!
Biostatistics & Data Analysis for Life Sciences
Originally developed for biology, medicine, and pharmacology, GraphPad Prism is now widely used across the life sciences—from students and PhD researchers to scientists in the pharmaceutical and healthcare industries.
✅ Easy-to-use statistical analysis tools for scientists
✅ Automated graphing for accurate data visualization
✅ Clear, easy-to-understand results interpretation
📌 No other software offers such intuitive and powerful curve fitting!
Powerful Statistical Tools in GraphPad Prism
GraphPad Prism includes a wide range of statistical tests and regression models to help you analyze your research data precisely and confidently.
Included Statistical Methods:
📊 t-tests (unpaired & paired)
📊 ANOVA (one-way, two-way, three-way)
📊 Nonparametric tests
📊 Linear & nonlinear regression
📊 Survival analysis (Kaplan-Meier)
📊 Contingency table analysis
💡 Especially for nonlinear regression, Prism offers advanced tools to calculate EC50, fit complex models, and compare curves with ease.
Scientific Graphing with Flexible Chart Customization
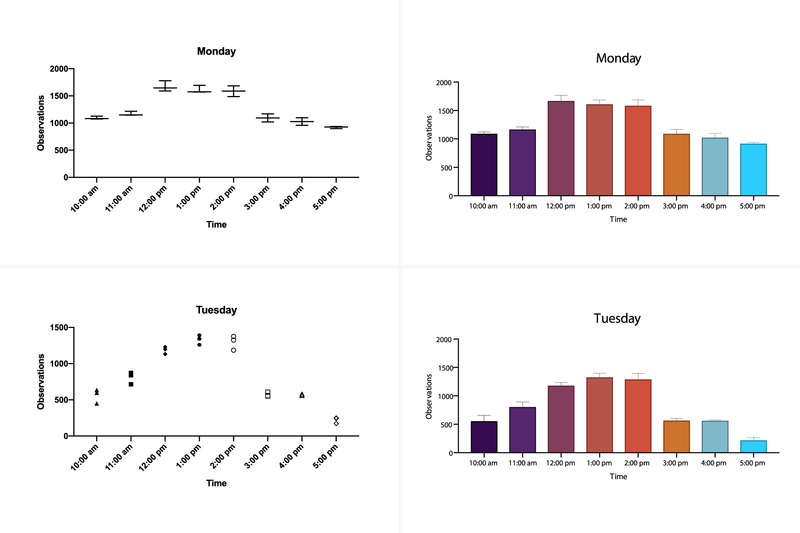
With GraphPad Prism, you can create high-quality scientific graphs that update automatically when your data changes.
🎨 Graphing Highlights:
✅ Automatically generated graphs based on your analyses
✅ Fully customizable axes, colors, labels, and layouts
✅ One-click templates for professional, consistent output
📈 Create perfect scientific visuals in just a few clicks!
Why Choose GraphPad Prism?
🔹 Fast & easy data analysis for scientists
🔹 Automated statistics and charting for accurate research
🔹 Comprehensive tools for biostatistics & nonlinear regression
🔹 Intuitive interface – perfect for students and professionals alike
🚀 Get started with GraphPad Prism and take your scientific research to the next level!
📥 Download your free trial now:
➡ Learn more & get the free trial
Price on request
NCSS
📊 NCSS – Your Powerful Statistical Software for Comprehensive Data Analysis
🚀 NCSS: The All-in-One Statistics Package for Your Data Analytics Needs
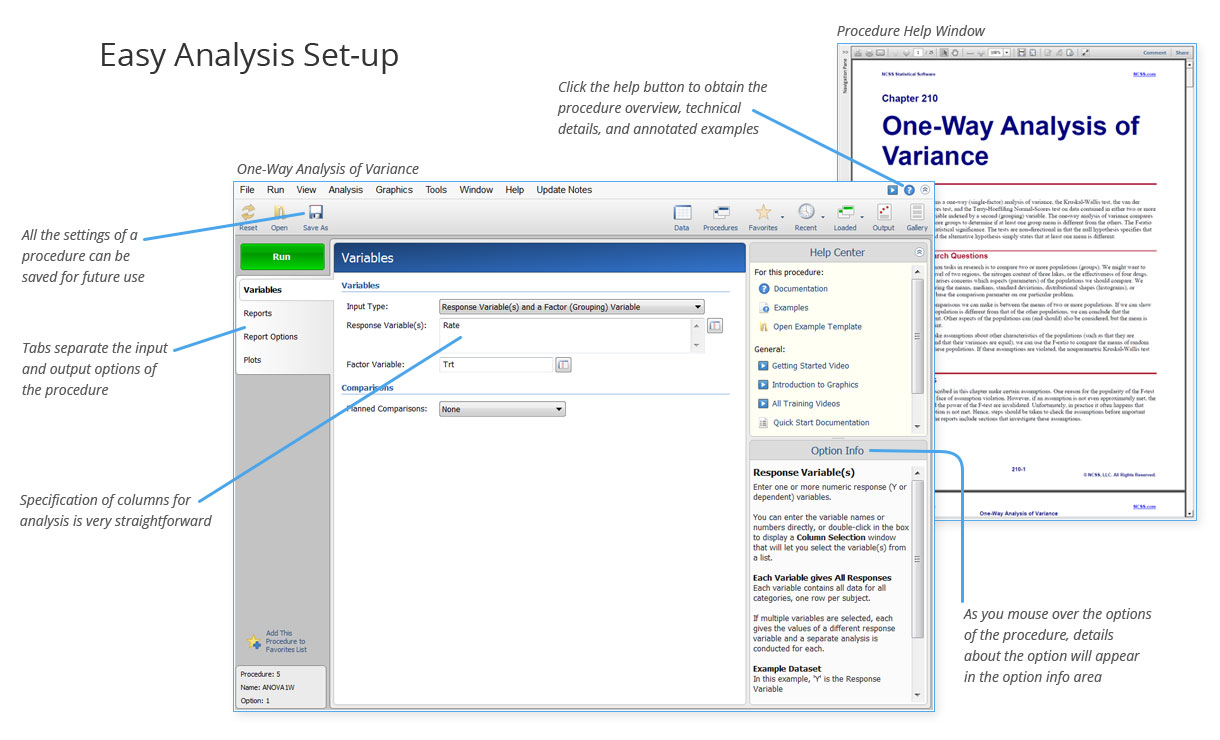
NCSS is a versatile statistical software solution that provides powerful tools for data analysis, forecasting, and statistical modeling. Whether you need descriptive statistics, regression analysis, Design of Experiments (DoE), or Statistical Process Control (SPC) – NCSS offers all the features you need for confident, data-driven decisions.
🌟 Why Choose NCSS?
✅ Comprehensive statistics suite – From basic descriptive methods to advanced modeling
✅ Intuitive menu navigation – Quickly find the right tool for your analysis
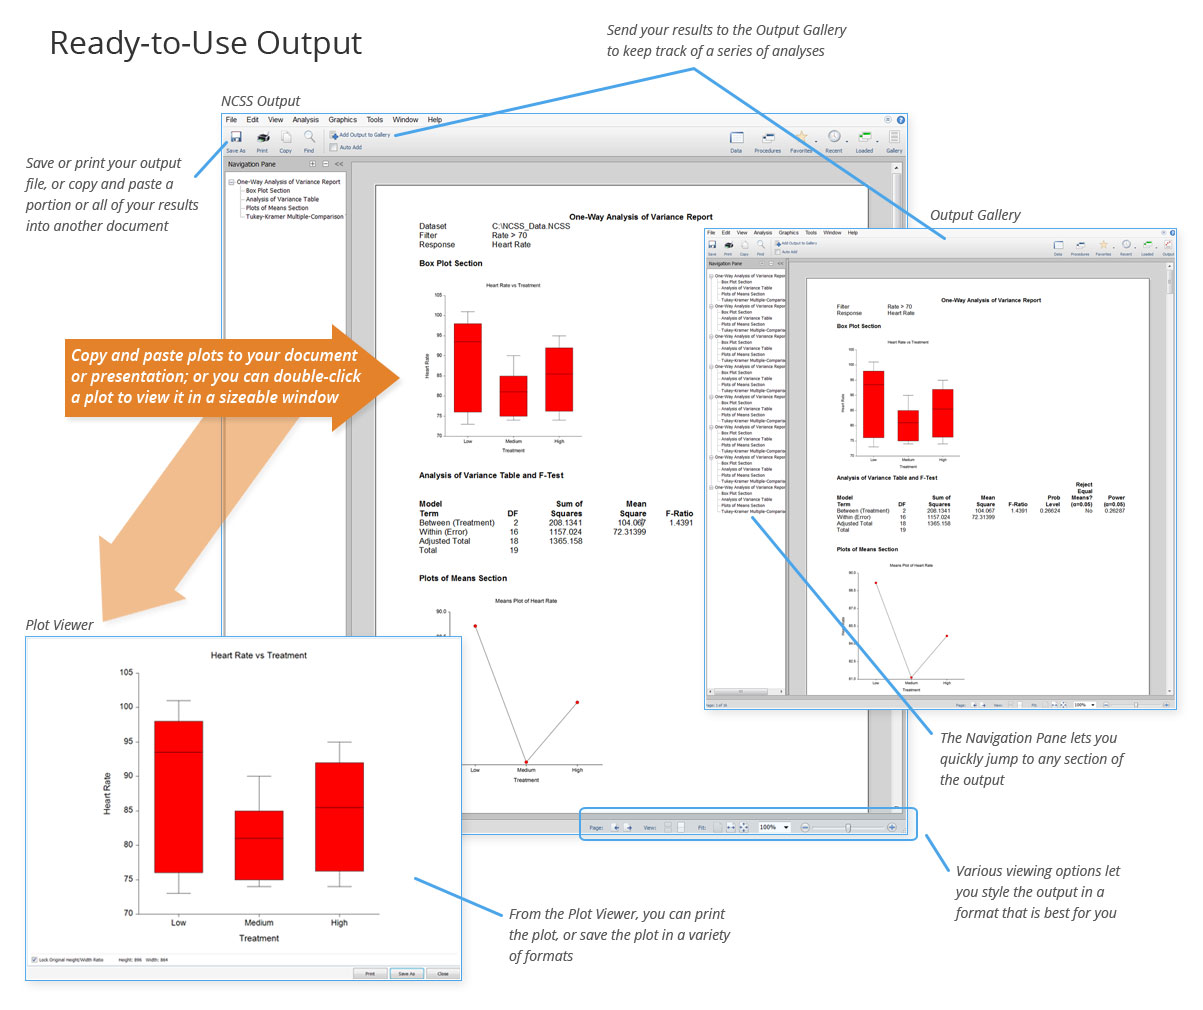
✅ High-quality data visualization – Clear, informative graphics for accurate interpretation
✅ Extensive documentation & learning resources – In-depth manuals and training videos included
🔍 Powerful Features for Your Analysis
📈 Data Analysis & Core Statistical Tools
✔ Descriptive statistics & mean comparisons for thorough data evaluation
✔ Regression analysis – from linear to generalized linear models (GLM) for precise prediction
✔ Time series analysis & ARIMA models – forecast trends based on historical data
🔬 Advanced Methods
✔ Design of Experiments (DoE) – Optimize products and processes
✔ Cluster analysis – Discover hidden patterns and groupings in complex datasets
✔ Survival analysis (Kaplan-Meier) – Reliability and risk assessment made easy
📊 Data Visualization & Reporting
✔ Dynamic charts and graphs to enhance your insights
✔ Automated reporting tools for professional, publication-ready results
🎯 NCSS – The Right Choice for Experts & Beginners Alike
Whether you're a scientist, data analyst, or quality control specialist, NCSS delivers the statistical power and flexibility to tackle any challenge—no programming required.
📢 Discover NCSS now and take your data analysis to the next level!
➡ Learn more and start your free trial
Price on request
nQuery
✅ Why Choose nQuery?
📏 Optimal Sample Size – Avoid underpowered or oversized studies
💰 Cost Reduction – Save significantly on clinical trials through precise planning
📈 Greater Efficiency – Enhance the statistical power and relevance of your results
🧠 370+ Procedures – Covers a wide range of study designs and statistical tests
⚕️ Trusted in Clinical Practice – Used globally by pharma, biotech & medical research institutions
🧬 Typical Use Cases
✔️ Clinical trials (Phases I–IV)
✔️ Medical research & epidemiology
✔️ Biostatistics & public health
✔️ Pharmaceutical development
✔️ Biotechnology & regulatory trial design
🛠️ Key Features at a Glance
🔹 Calculate sample size for a wide variety of statistical tests and study designs
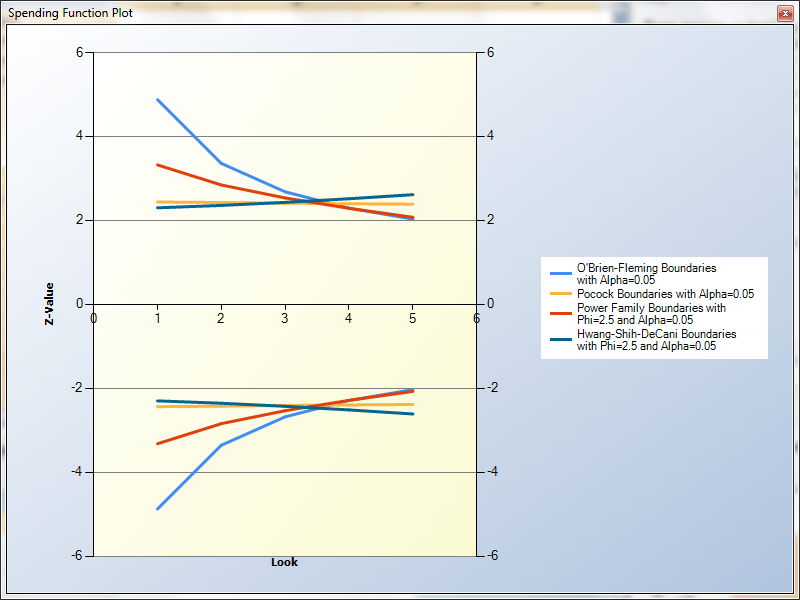
🔹 Perform power analysis for fixed sample sizes
🔹 Plan studies including parallel groups, crossover designs, survival analysis, non-inferiority trials, and more
🔹 Supports both classical and modern methodologies
🔹 User-friendly interface with comprehensive documentation and guidance
📌 Conclusion: nQuery – Plan with Confidence. Research with Efficiency.
nQuery ensures your clinical study is neither underpowered nor over-resourced. That means more reliable results, better decision-making, and optimized resource use. Get your study design right from the start—with nQuery.
📥 Discover nQuery & request your free demo today!
➡ Contact us for pricing, consultation, or a personalized trial.
Price on request
NVivo
🧠 NVivo® – The Leading Software for Qualitative Data Analysis (QDA)
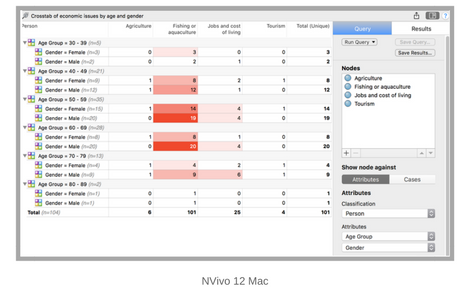
NVivo is the globally recognized solution for analyzing qualitative and mixed-methods data. Whether working with interviews, open-ended responses, social media content, or academic literature, NVivo helps you organize, analyze, and interpret unstructured data quickly, systematically, and with analytical depth.
🔍 Why NVivo?
✅ Supports qualitative and mixed-methods research
✅ Import from multiple sources – text, video, images, social media, surveys, and reference libraries
✅ Flexible coding options – thematic, case-based, in-vivo, relational, and automated coding
✅ Powerful visualization and analysis tools
✅ Seamless team collaboration, including real-time co-authoring
✅ Integrated transcription solution and API connectivity
🧩 NVivo Plus (Windows) – For Deeper Insights and Automation
Everything included in NVivo Pro, plus:
🚀 Automated coding based on themes, patterns, and sentiment
📊 Social network analysis – Visualize connections and information flows
💬 Quickly identify key themes and emerging trends
⚙️ Use framework matrices and AI-powered data interpretation
💼 Key Features of NVivo Plus
🔹 Import text, images, audio, video, spreadsheets, surveys, and online content
🔹 Manual and automatic coding by themes or keywords
🔹 Identify patterns in large datasets with built-in auto-coding tools
🔹 Summarize and structure findings using framework analysis
🔹 Conduct social network analysis – e.g., in interviews or organizations
🔹 Collaborate with your team – locally or in real time with NVivo Teams
🔹 Generate powerful visualizations: mind maps, clusters, word frequency clouds, and network diagrams
🔹 Export insights for reports, presentations, or further analysis
🧰 NVivo Pro (Windows) – The Powerful Standard Edition
Perfect for thorough qualitative and mixed-methods research.
🔹 Import and analyze content in nearly any language
🔹 Review coded data with highlights and coding stripes
🔹 Use queries: text search, word frequency, coding comparison, matrix coding
🔹 Visualize insights with models, charts, and heatmaps
🔹 Built-in transcription with NVivo Transcription
🔹 Import data from SurveyMonkey, Mendeley, EndNote, Zotero, Evernote, OneNote
🔹 Exchange data with SPSS, Excel, and Access for mixed-methods workflows
🔹 Collaborate using project merge and team sharing features
📦 Comparison: NVivo Pro vs NVivo Plus
FeatureNVivo Pro ✅NVivo Plus ✅Manual coding✅✅Automatic coding⚪✅Social network analysis⚪✅Theme & sentiment analysis⚪✅Framework matrices✅✅Visualizations & queries✅✅Teamwork & data import✅✅
🎯 Who Uses NVivo?
✔️ Social and educational sciences
✔️ Healthcare and nursing research
✔️ Political science & communication studies
✔️ Organizations conducting qualitative employee or customer analysis
✔️ Mixed-methods projects in academia and applied research
💬 Conclusion: NVivo – Dig Deeper. Understand More. Research Better.
With NVivo, you get a comprehensive solution to organize, code, and analyze qualitative data effectively—whether you work independently or as part of a team, on small studies or large-scale research projects.
📥 Try NVivo for free or request a quote today:
➡ Learn more at the official NVivo website from QSR International: www.qsrinternational.com/nvivo
Price on request
PASS
🧪 PASS® – Professional Software for Sample Size Calculation & Power Analysis
PASS is one of the leading solutions for sample size determination, power analysis, and statistical precision planning—essential for clinical trials, medical research, and pharmaceutical development projects.
With over 680 validated procedures and 230+ study designs, PASS offers unmatched methodological flexibility in a highly intuitive interface.
✅ Why Choose PASS?
📊 680+ validated procedures for power and sample size analysis
🔬 230+ study design templates for maximum methodological versatility
🖥️ Intuitive workflow – Get results in just 3 steps: choose a design, enter parameters, interpret output
📈 Built-in visualizations – Clean, exportable graphs and plots for every analysis
📄 Compatible with Word, Excel, and more – Export results directly into reports and presentations
🧠 Easy to learn, fast to apply – Ideal for researchers, statisticians, and trial planners
🔍 Typical Applications
✔️ Clinical trial planning (Phase I–IV)
✔️ Pharmacological & epidemiological studies
✔️ Biostatistics & health sciences
✔️ Medical devices & public health research
✔️ Academic & regulatory study planning
🧩 Key Features at a Glance
🔹 Optimal sample size calculation
🔹 Perform power analysis for a wide range of statistical tests
🔹 Analyze statistical test sensitivity and power
🔹 Supports designs including: parallel groups, crossover, survival analysis, non-inferiority, and more
🔹 Confidence interval planning & effect size estimation
🔹 Support for one- and two-sided hypothesis testing
🔹 Clear output with inline help, definitions, and guidance
🔹 Expandable report builder with notes, custom text & selected output exports
🛠️ Examples of Included Tests
📍 t-tests (one-sample, two-sample, paired)
📍 ANOVA & ANCOVA
📍 Chi-square tests
📍 Logistic regression
📍 Cox regression
📍 Survival analysis
📍 Poisson models
📍 Non-inferiority & equivalence tests
📍 Confidence interval planning for means, proportions, and more
💬 Conclusion: PASS – Your Trusted Partner for Precise Study Design
With PASS, you can avoid under- or overpowered studies, save time and resources, and ensure the statistical integrity of your research. Whether you're working in clinical trials, pharma, or public health, PASS provides the ideal combination of scientific depth and ease of use.
📥 Try PASS or request a consultation today:
➡ Learn more at the official PASS website: www.ncss.com/software/pass
Price on request
SigmaPlot
📈 SigmaPlot® – Advanced Technical Graphing & Data Analysis
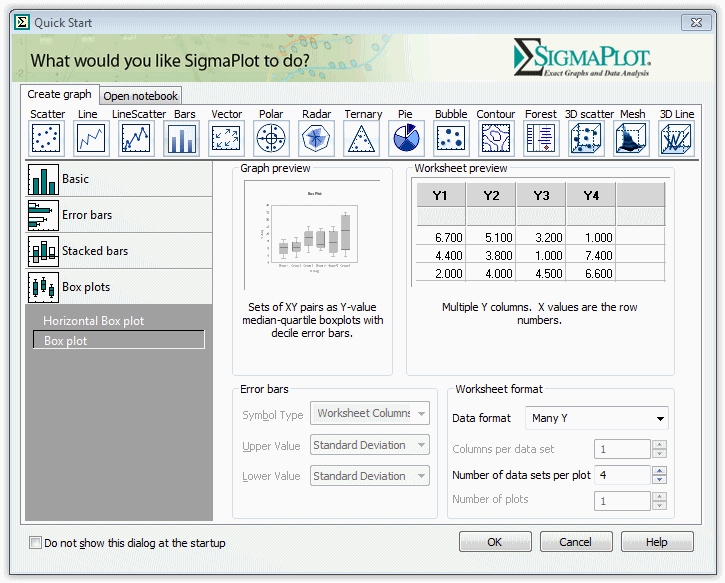
SigmaPlot is the leading software for creating high-quality 2D and 3D scientific graphs and performing precise data analysis. Designed for researchers, engineers, and scientists, SigmaPlot generates publication-ready visuals while offering a robust set of statistical tools—making it ideal for high-level research, documentation, and scientific presentations.
✅ Why Choose SigmaPlot?
🧪 Accurate scientific visualizations in 2D & 3D
📊 50+ built-in statistical tests, including Kaplan-Meier, Bland-Altman, curve fitting & more
🖼️ Publication-quality graphics – ideal for journals, reports, and conferences
🔁 Macro automation for repetitive tasks and workflows
📎 Seamless integration with Microsoft Excel, Word, and PowerPoint
🎨 New Ribbon UI & redesigned Graph Properties dialog for faster productivity
✨ What’s New in the Latest Version of SigmaPlot?
🔹 Scatter matrix plots with up to 40 variables
🔹 Filled arrowheads for precise annotation
🔹 Multi-column sorting based on index columns
🔹 Oneway frequency tables & new chart types
🔹 Streamlined workflows with fewer clicks and faster graphing
📊 Powerful Graphing Features
✔️ Customizable axis scales for technical presentations
✔️ Multi-axis layout support
✔️ Regression analysis & nonlinear curve fitting
✔️ Automatic error bars & confidence intervals
✔️ Enzyme kinetics & specialized scientific chart types
🧠 Built-In Statistics Advisor
SigmaPlot includes a Statistics Advisor that guides you to the right statistical test and walks you through its application step by step.
📌 Examples include:
• t-tests, ANOVA, nonparametric tests
• Kaplan-Meier survival analysis
• Bland-Altman method comparison
• Regression models & curve fits
• Enzyme kinetics and more
🔄 Optimized for the Microsoft Office Workflow
🔗 One-click data import from Excel
📄 Insert SigmaPlot charts directly into Word & PowerPoint
📤 Export high-resolution graphics for publication or presentation
🎯 Conclusion: SigmaPlot – When Your Research Demands Clarity
Whether in medicine, life sciences, chemistry, physics, or engineering, SigmaPlot delivers everything you need for professional-level data visualization and analysis. Intuitive to use, powerful in output.
📥 Learn more or request a free trial:
➡ Visit the official SigmaPlot product page: www.systat.com/products/sigmaplot
Price on request


