Skip to main content Skip to search Skip to main navigation
Menu

Qs-STAT

qs-STAT includes numerous statistical methods for analyzing relevant quality characteristics in your processes.
Description

Product information "Qs-STAT"

📊 Q-DAS qs-STAT® – Reliable Industrial Statistics for Quality Evaluation

Q-DAS qs-STAT® is the industry-established software solution for standardized and insightful statistical evaluations in manufacturing. It provides reliable quality metrics, supporting process-secure decision-making, continuous improvement, and globally comparable results.


Why Choose qs-STAT?

📈 Validated statistical methods according to international standards
📏 Integrated norms & guidelines – e.g., DIN ISO 22514-2 and OEM-specific standards (BMW, Bosch, VW, GMPT, etc.)
🌍 Multilingual interface – optimized for global users
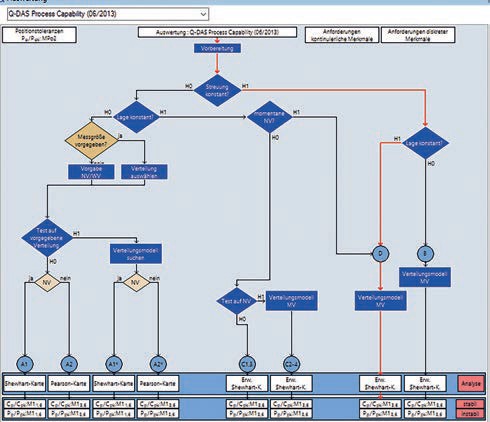
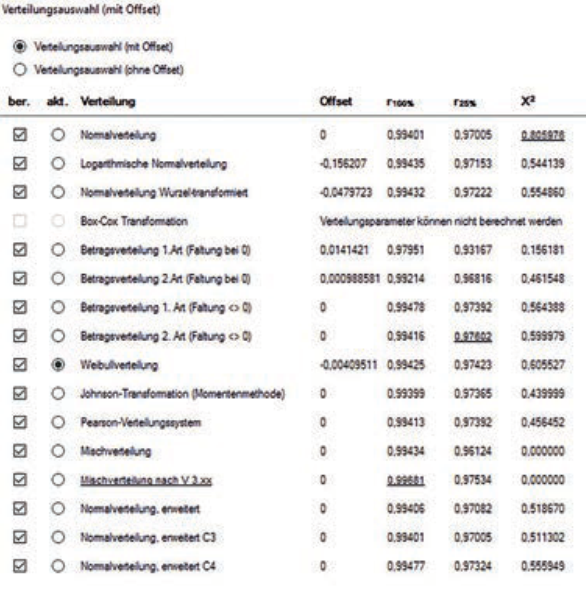
🧠 Automatic distribution analysis & process model assignment
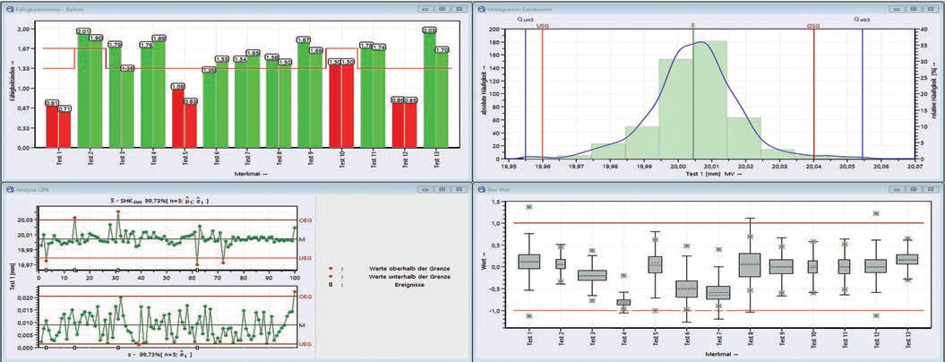
🖥️ Intuitive visualizations – quickly identify critical process deviations
🔄 SAP integration (QM-STI) – use quality metrics & reports directly within your SAP system
🔒 Conformity declaration for compliant use in certified QM environments


🛠️ Key Features at a Glance

🔹 Statistical evaluation of manufacturing-relevant quality data
🔹 Automatic selection of the best-fitting distribution model
🔹 Assignment to appropriate process models (per ISO 22514-2)
🔹 Powerful filter and selection tools for targeted analysis
🔹 Customizable reports & dashboards for various user roles
🔹 Multilingual user interface – ideal for global manufacturing networks
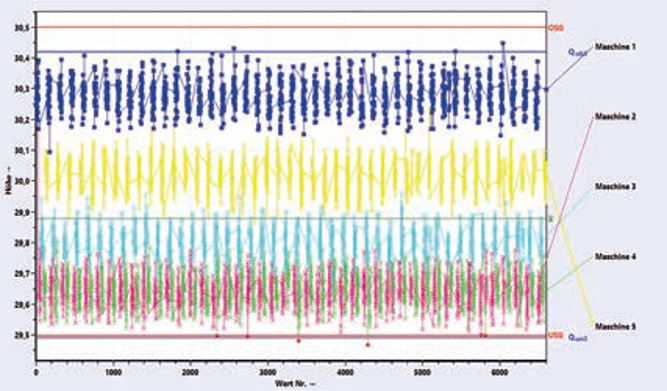
🔹 Supports process and machine capability studies


📊 Clear Visual Insights – Instant Process Understanding

✔️ High-impact charts and graphs – including boxplots, trend charts, capability analyses
✔️ Highlighting of critical deviations – built-in visual alert systems
✔️ Clean, intuitive layouts – focus on exceptions and optimization opportunities
✔️ Direct derivation of corrective actions – fast, data-driven decisions


🔗 Seamless SAP Integration (QM-STI)

📎 If your inspection and measurement data is stored in SAP QM, qs-STAT can automatically analyze it. All metrics, charts, and reports are directly accessible in your SAP system – combining the strengths of both platforms for effective quality assurance.


🔒 Certified Suitability for Norm-Compliant Use

✔️ Meets key quality standards like ISO 9001, IATF 16949, and others
✔️ Verified suitability for initial and continuous deployment
📄 View Declaration of Suitability (PDF)


💬 Conclusion: qs-STAT – The Industrial Standard for Statistical Process Evaluation

Q-DAS qs-STAT is the go-to solution for companies requiring transparent, standardized, and globally understandable quality analysis – from shop floor to top floor, from local plants to global enterprises.

📥 Learn more or request a free demo now:
➡ Visit the Q-DAS product page: www.q-das.com


Skip product gallery

SPC

SOSstat - Quality
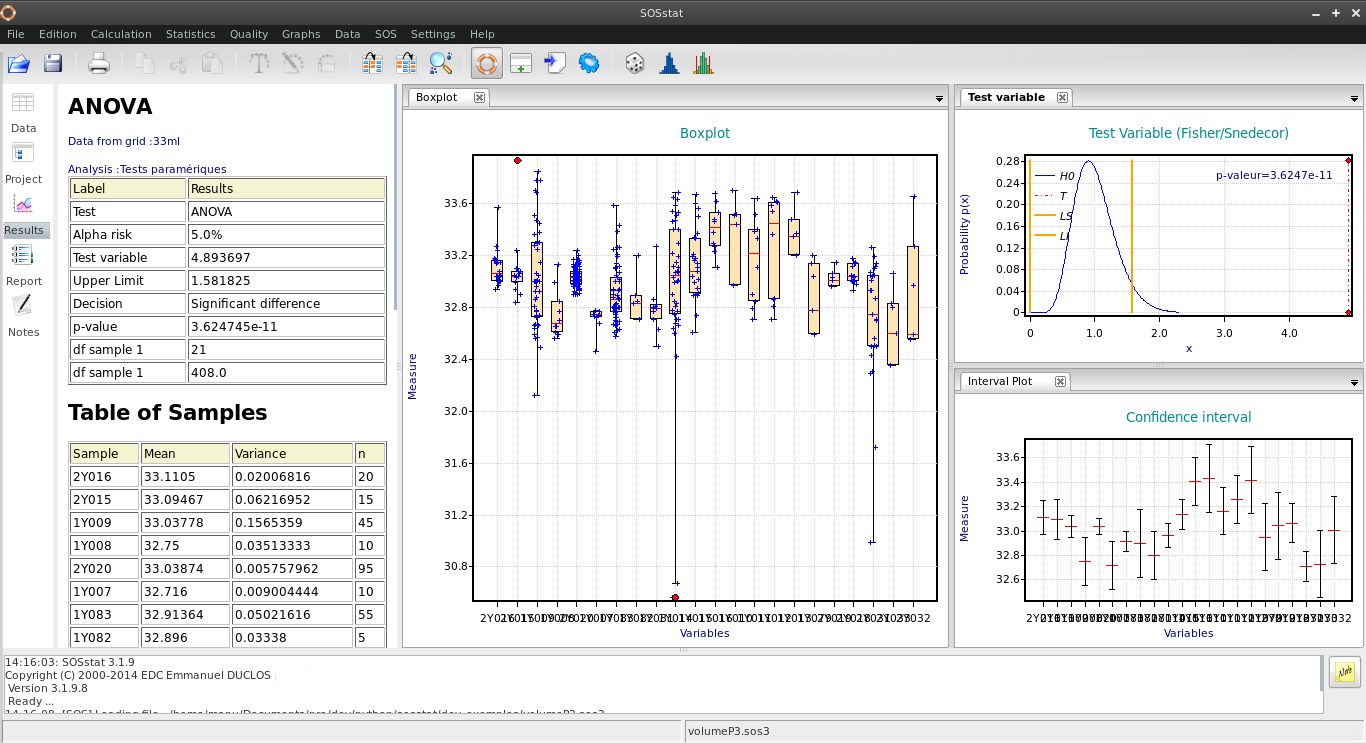
🏭 SOSstat Quality® – Statistical Software for Industrial Quality Improvement SOSstat Quality is a powerful software solution for statistical process control (SPC) and quality improvement in industrial environments. Specifically designed for engineers, technicians, and production teams, it combines ease of use with robust statistical tools, enabling quick and accurate analysis with minimal training. ✅ Why Choose SOSstat Quality? 🔍 Comprehensive statistical tools – For process analysis, monitoring, and optimization 📊 Modern visualizations & intuitive graphics – For fast, clear insights 🛠️ Built for industrial use – Ideal for manufacturing, quality management & validation 🚀 Integrated Six Sigma project management – Supports continuous improvement initiatives 🧠 Assistant-guided workflows – Designed for users with or without statistical expertise 🌐 Application Areas ✔️ Microelectronics & semiconductor industry ✔️ Aerospace & aviation ✔️ Mechanical & automotive engineering ✔️ Plastics & textile manufacturing ✔️ Medical devices & precision instruments ✔️ Quality management & regulatory validation 🧪 SOSstat VPAQ® – Simplifying Analytical Method Validation SOSstat VPAQ is a specialized tool for the validation of quantitative analytical methods – ideal for industries where regulatory compliance and scientific precision are critical. 🎯 Designed for: ✔️ Chemical analysis ✔️ Pharmaceutical quality assurance ✔️ Food testing and laboratory analytics With SOSstat VPAQ®, you can perform validations based on internationally recognized standards – accurately, efficiently, and in full compliance. 📐 Validation According to International Guidelines 📏 Total Error approach – Scientifically robust and easy to interpret 📘 Compliant with SFSTP & NF V 03-110 🌍 Aligned with ICH guidelines & ISO 5725 🔬 Scientifically validated & industry-proven – Trusted across sectors worldwide 🎯 Key Benefits at a Glance 🔒 Regulatory-compliant validation methodology 📈 Improved accuracy & reproducibility 📎 Demonstrable quality of products & processes 📂 Reliable documentation & integrated project tracking 💬 Conclusion: SOSstat – Quality at the Highest Level Whether you're conducting a production analysis, leading a Six Sigma project, or performing method validation – SOSstat Quality® and SOSstat VPAQ® provide the essential tools to work efficiently, transparently, and in full compliance with industry standards. 📥 Learn more & request your free demo today! ➡ Contact us for product information or personal consultation.

Price on request
Predisys Analytical Suite
🏭 Predisys Analytical Suite® – Intelligent SPC Software for Industry 4.0 Predisys Analytical Suite is a scalable, browser-based solution for Statistical Process Control (SPC) and quality-related data analysis—purpose-built for the demands of Industry 4.0. The software enhances product quality, reduces operational costs, and delivers transparency and control across manufacturing processes. ✅ Why Choose Predisys? 🔧 Comprehensive SPC functionality – Control charts, process monitoring & root cause analysis 📈 Improved quality & cost-efficiency – Identify trends and deviations early 🌐 Fully browser-based – No local installation, ideal for IT teams & global collaboration 🧠 Industry 4.0 ready – Easily integrates with Lean, Six Sigma, TQM & digital manufacturing strategies 📊 For beginners & experts alike – Intuitive dashboards for plant managers, detailed analytics for quality engineers 💼 Built on Microsoft SharePoint – Scalable, secure, and enterprise-ready platform integration 🧩 Key Features of the Predisys Analytical Suite 🔹 Statistical Process Control (SPC): • Multiple control chart types (X̄-R, p, np, u, c, etc.) • Automated trend detection and deviation analysis • Visual alerts & customizable control limits 🔹 Quality Data Analytics: • Advanced statistical tools and analytics • Monitor quality metrics over time and across product lines • Integration with MES/ERP systems for automated data flow 🔹 Digitalization & Industry 4.0: • Real-time, connected quality data across systems • Support for IoT/sensor-driven production environments • Ideal for Predictive Quality and Continuous Improvement initiatives 🔹 User-Friendly Interface: • Role-based dashboards tailored for different user levels • One-click export of reports & visualizations • Granular permission settings and secure data access 🌍 Typical Use Cases ✔️ Automotive & suppliers ✔️ Mechanical & plant engineering ✔️ Electronics & microelectronics manufacturing ✔️ Plastics & metal processing ✔️ Aerospace & defense industries ✔️ Medical technology & high-tech production 💬 Conclusion: Predisys – SPC and Quality Intelligence for Connected Manufacturing With Predisys Analytical Suite, organizations leverage a future-ready platform for quality monitoring, continuous improvement, and production intelligence. It combines the strengths of traditional SPC with modern Industry 4.0 integration—intuitive, powerful, and fully browser-based. 📥 Learn more or request a demo now: ➡ Visit the Predisys Product Page Möchtest du auch eine Kurzversion für LinkedIn, ein Executive Summary für Entscheider oder eine Gegenüberstellung mit klassischen On-Premise-SPC-Systemen? Gib mir einfach Bescheid!

Price on request
Minitab
Minitab is a powerful statistical software for statistical analysis of data e.g. in research and quality management. Using an interactive wizard, the program offers a comprehensive range of statistical methods and graphical tools allowing to perform safely and successfully the steps of an analysis. Therefore, it is useful for industry, research, development and teaching.The system environment facilitates the steps from data import to 2D and 3D data visualization up to data exploration and analytical statistics. The project management, reporting and documentation of the results are logical and flexible to handle.Minitab is used worldwide for the implementation of Six Sigma projects and provides standard statistical methods, ANOVA, regression, quality tools, quality control charts, life cycle and reliability analysis, measurement system analysis, process capability analysis, design of experiments (DoE), excellent graphs and much more.Minitab shows an extreme adaptability, supported both by the integrated programming language allowing to automate processes and by the option to compile menus individually. Thus, it is not only possible to define company-wide standards, but also to adapt Minitab to the company's needs, giving the users only those analysis at hand which is actually needed.Arguments for Minitab:Minitab offers a comprehensive range of statistical methods and graphical toolsMinitab supports you in all phases of a Sig Sigma processMinitab is very adaptable and programmable Minitab - The 'All-In-One' Statistical and Graphical Analysis Software PackageMinitab is one of the leading providers of statistical software and services for quality management, education and research.Minitab provides precise but easy to use functions for quality management and general statistics. Minitab is used by plenty of leading companies like General Electric, Ford Motor Company, General Motors, 3M, Honeywell International, LG, Toshiba, Nokia and many leading Six Sigma consultants.As an introduction to statistics, Minitab is also established in more than 4.000 technical schools and universities. Minitab's head office is located in State College, PA, USA and has branch offices in the UK, France and business partners across the whole world.Interactive Assistant for smooth AnalysisMinitab gives you the confidence you need to improve quality, with features like an interactive assistant that guides you through your analysis. It is specifically designed to help you succeed at every step of your analysis. Once you've chosen the right tool, the assistant identifies all the steps you should take to ensure the results of your analysis are accurate and trustworthy.Step by Step GuidanceAn interactive decision tree leads you to the right statistical tool by posing a series of questions you need to answer, such as the type of data you're working with and the objective of your analysis. When you face a question you can't answer, the assistant provides the information you need to respond correctly, such as the definitions of important terms and illustrated examples that help you understand how the question relates to your own data.Dialogs helps you running analysis quick and easyThe assistant's dialogs are simple to complete. Steps have been streamlined and the text that accompanies the input fields is accessible and direct. Fields will even dynamically change based on your input.Interpret your results with confidenceSummary reports help you draw the correct conclusions and explain why. They illustrate the answers to important questions, and include comments that give your analysis context and meaning.Diagnostic reportDiagnostic reports help you further understand your analysis by providing additional detail, such as outliers you should explore and the chance of detecting a significant difference.Report cardReport cards verify your analysis by providing assumption checks and identifying any concerns you should be aware of, such as unusual data points and issues with normality and sample size.Start using the software immediately!Minitab's interface is intuitive and easy to use.An extensive selection of statistical methodsBasic statisticsAccess a complete set of statistical tools, including descriptive statistics, hypothesis tests, confidence Intervals and normality tests.Regression and ANOVAUncover the relationships between variables and identify important factors affecting the quality of your products and services.Quality toolsDetermine if your measurement systems are adequate, assess how well your processes meet specification limits, create sampling plans, and more.Design of Experiments (DoE)Find the settings that optimize your processes using factorial, response surface, mixture and Taguchi designs.Control chartsMonitor your processes over time and evaluate their stability.Reliability and survivalDetermine a product's lifetime characteristics using a wide range of tools including distribution analysis and accelerated life testing.Dig Deeper into your DataMinitab graphs are powerful tools for investigating your process further and removing any doubt about the steps you should take to improve it.Automatically update your graphs and control charts when you add or edit data.Select and examine points of interest, then use them to create alternate data sets and graphs.Share your ResultsSharing your findings with colleagues is easy. Minitab's assistant automatically produces a comprehensive, straightforward summary of your analysis that includes relevant graphs and output, and how to interpret them. And there is more, Minitab's rich graphs are the building blocks of an engaging and professional presentation. They are simple to edit, and you can export them directly to MS Word and PowerPoint. Further InformationMinitab Homepage

Price on request