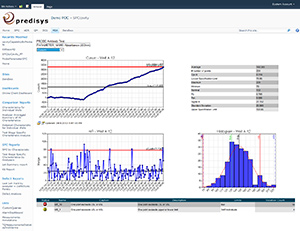
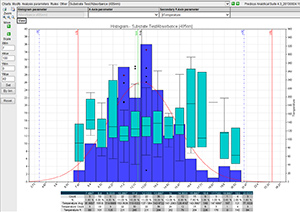
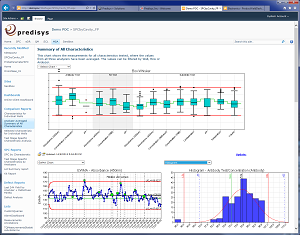
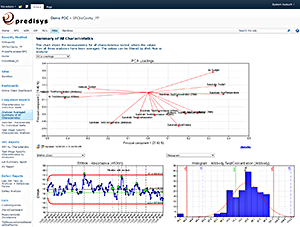
A partial list of SPC functionality
Predisys SPC for Microsoft Reporting Services comes with rich SPC functionality and supports the following control charts and statistical indices as well as other functionality, such as WECO and custom rules.
Control Charts
- Variable Control Charts
- Xbar and Sigma chart
- Xbar and Range chart
- X/MR, I/MR charts
- MX/MR (Moving Average) chart
- Three Way Control chart
- Run chart
- Individuals chart
- Cusum chart
- Short Run chart
- EWMA chart
- Z chart
- W chart
- Capability Histogram chart
- Normal Probability Plot chart
- Autocorrelation chart
- Measurement Pareto chart
- SPC Box-Whisker chart
- Histogram Box-Whisker chart
- CV
- Attribute Control Charts
- P, nP, U and C charts
- Yield, FPY, PPM charts
- Rolled throughput yield chart
- Pareto chart
- Production volume & throughput
- Histogram
- Other Chart Types
- Scatter plot
- Lines chart - standard
Statistical Indices
- Capability Analysis
- Cp (R, S, mR)
- Cpk (R, S, mR)
- Pp
- Ppk
- Cpl (R, S, mR)
- Cpu (R, S, mR)
- Ppu
- Ppl
- Cpm
- Actual measurements above USL
- Actual measurements below LSL
- Measurements inide specs
- Measurements outside specs
- Estimated above USL
- Estimated below LSL
- Estimated PPM above USL
- Estimated PPM below LSL
- Average number of defects
- Defects percentages
- Defectives percentages
- Proportion of defects
- Other Statistics
- +3S, +4S, +5S, +6 (R, S)
- -3S, -4S, -5S, -6 (R, S)
- Anderson Darling Statistics
- Average
- Coefficient of variation
- Critical value
- Degrees of freedom
- DPMO
- Grand Average
- K value
- Kurtosis
- Long term sigma level
- Short term sigma level
- Maximum and Minimum
- Median
- Nominal
- Normality Test (Anderson Darling)
- Number of subgroups
- Number of outliers
- Offset
- Range
- Short run statistics
- Skewness
- Stability Index
- Subgroup size
- Z


