Skip to main content Skip to search Skip to main navigation
Menu

PASS

PASS is a simple yet powerful program for determining the size of an experimental design. PASS performs power analyses and calculates sample size.
Description

Product information "PASS"

🧪 PASS® – Professional Software for Sample Size Calculation & Power Analysis

PASS is one of the leading solutions for sample size determination, power analysis, and statistical precision planning—essential for clinical trials, medical research, and pharmaceutical development projects.

With over 680 validated procedures and 230+ study designs, PASS offers unmatched methodological flexibility in a highly intuitive interface.


Why Choose PASS?

📊 680+ validated procedures for power and sample size analysis
🔬 230+ study design templates for maximum methodological versatility
🖥️ Intuitive workflow – Get results in just 3 steps: choose a design, enter parameters, interpret output
📈 Built-in visualizations – Clean, exportable graphs and plots for every analysis
📄 Compatible with Word, Excel, and more – Export results directly into reports and presentations
🧠 Easy to learn, fast to apply – Ideal for researchers, statisticians, and trial planners


🔍 Typical Applications

✔️ Clinical trial planning (Phase I–IV)
✔️ Pharmacological & epidemiological studies
✔️ Biostatistics & health sciences
✔️ Medical devices & public health research
✔️ Academic & regulatory study planning


🧩 Key Features at a Glance

🔹 Optimal sample size calculation
🔹 Perform power analysis for a wide range of statistical tests
🔹 Analyze statistical test sensitivity and power
🔹 Supports designs including: parallel groups, crossover, survival analysis, non-inferiority, and more
🔹 Confidence interval planning & effect size estimation
🔹 Support for one- and two-sided hypothesis testing
🔹 Clear output with inline help, definitions, and guidance
🔹 Expandable report builder with notes, custom text & selected output exports


🛠️ Examples of Included Tests

📍 t-tests (one-sample, two-sample, paired)
📍 ANOVA & ANCOVA
📍 Chi-square tests
📍 Logistic regression
📍 Cox regression
📍 Survival analysis
📍 Poisson models
📍 Non-inferiority & equivalence tests
📍 Confidence interval planning for means, proportions, and more


💬 Conclusion: PASS – Your Trusted Partner for Precise Study Design

With PASS, you can avoid under- or overpowered studies, save time and resources, and ensure the statistical integrity of your research. Whether you're working in clinical trials, pharma, or public health, PASS provides the ideal combination of scientific depth and ease of use.

📥 Try PASS or request a consultation today:
➡ Learn more at the official PASS website: www.ncss.com/software/pass


Details

🎯 PASS® – Effortless and Professional Power Analysis & Sample Size Calculation

PASS is a powerful yet user-friendly software solution for sample size determination and power analysis. With over 680 statistical procedures and scenarios, PASS offers one of the most comprehensive collections of validated methods for study planning and trial evaluation—clear, efficient, and scientifically sound.


Why Choose PASS?

📈 680+ statistical procedures – for nearly every study design
🧠 Calculates power, sample size, effect size, and alpha error
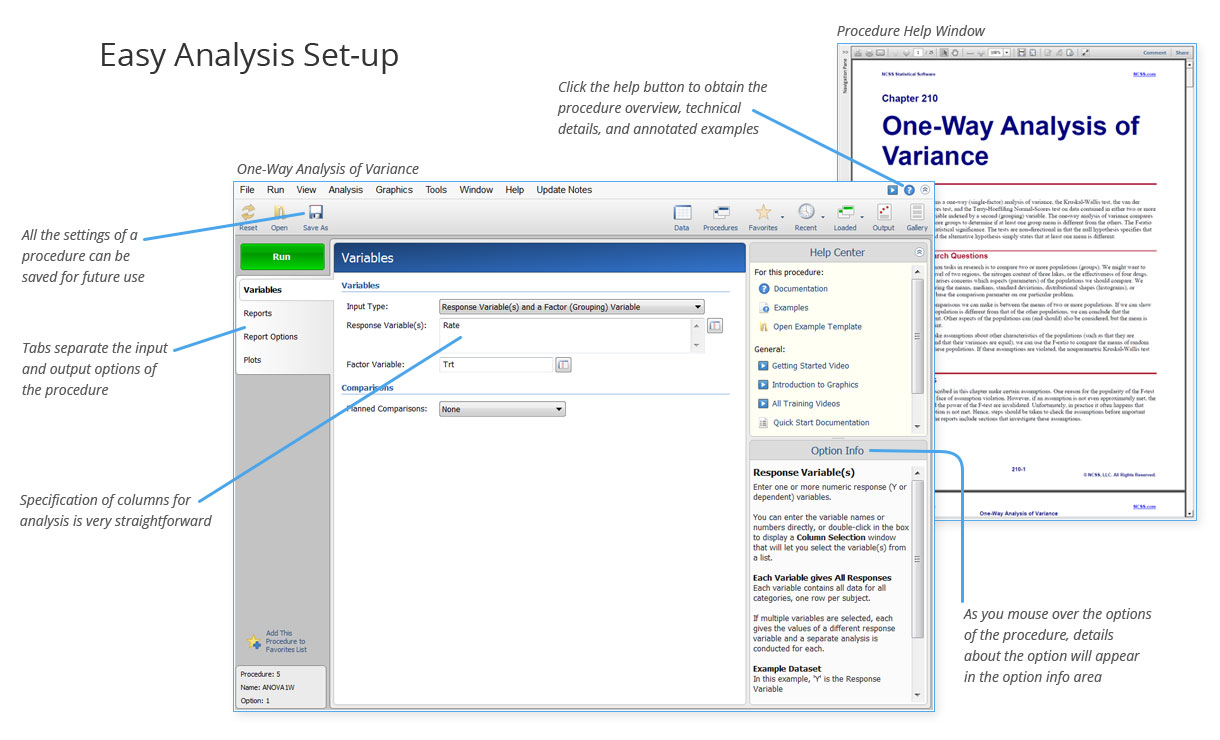
🖱️ Easy to use – Clear navigation for data input and method selection
📊 Auto-generated charts and summaries – Instantly exportable for reporting
📄 Clear, well-structured output – Ready for use in reports and publications
💬 Built-in help & tutorials – Includes formulas, examples, and references
💻 Standalone software – No dependency on other statistics programs
📚 Validated results – Each procedure is scientifically documented


🔬 Common Use Cases

✔️ Clinical trials (Phases I–IV)
✔️ Pharmaceutical research & development
✔️ Epidemiological studies
✔️ Public health & healthcare sciences
✔️ Biostatistics & academic research


🧩 Feature Overview

🔹 Power analysis – Supports over 230 study designs
🔹 Sample size calculation – For tests and confidence intervals
🔹 Post hoc power estimation – Evaluate the strength of existing studies
🔹 Advanced visualizations – Power curves, effect size comparisons & more
🔹 Ready-to-use outputs – Copy directly into Word, Excel, and other tools
🔹 Multi-output manager – Gallery-style result navigation
🔹 Comprehensive documentation – Includes help texts, videos, formulas & references


🛠️ How PASS Works in 3 Simple Steps

1️⃣ Choose your study design – Use dropdown menus, search, or category filters
2️⃣ Enter parameters – Guided input fields with context-sensitive help
3️⃣ Interpret your results – With clear graphs and textual summaries
➡️ Optional: Save, export, or insert your results into reports (e.g., MS Word)


💬 Conclusion: PASS – Your Trusted Tool for Accurate Study Planning

PASS is the ideal software for anyone involved in clinical, medical, or academic research who needs solid, evidence-based study planning. It is more comprehensive, intuitive, and cost-effective than many comparable tools—and it runs independently of other statistics software.

📥 Learn more or try the free demo today:
➡ Visit the official PASS product page at NCSS.com

Requirements

Systemvoraussetzungen für die Software PASS


In order to run PASS, your computer must meet the following minimum standards:

  • Processor:
    • 450 MHz or faster processor
    • 32-bit (x86) or 64-bit (x64) processor
  • RAM:
    • 256 MB (512 MB recommended)
  • Operating Systems:
    • Windows 10 or later
    • Windows 8.1
    • Windows 8
    • Windows 7
    • Windows Vista with Service Pack 2 or higher
    • Windows Server 2016 or later
    • Windows Server 2012 R2
    • Windows Server 2012
    • Windows Server 2008 SP2/R2
  • Privileges:
    • Administrative rights required during installation only
  • Third Party Software:
    • Microsoft .NET 4.6 (Comes pre-installed with Windows 10 or later and Windows Server
      2016 or later. Installation required on Windows 8.1 or earlier and Windows Server
      2012 R2 or earlier. For systems where .NET 4.6 installation is required, a .NET 4.6
      download helper will start automatically when you run the PASS setup file.
      )
    • Microsoft Windows Installer 3.1 or higher
    • Adobe Reader® 7 or higher (required for the Help System only)
  • Hard Disk Space:
    • 220 MB for PASS (plus space for Microsoft .NET 4.6 if not already installed)
  • Printer:
    • Any Windows-compatible inkjet or laser printer
    •  

PASS on a Mac

A Windows emulator (such as Parallels) is required to run PASS 16 on a Mac.

Details

What's New in PASS 2020?


PASS adds 38 new sample size procedures and 33 updated or improved procedures. Among the new and updated procedures are those for 
 
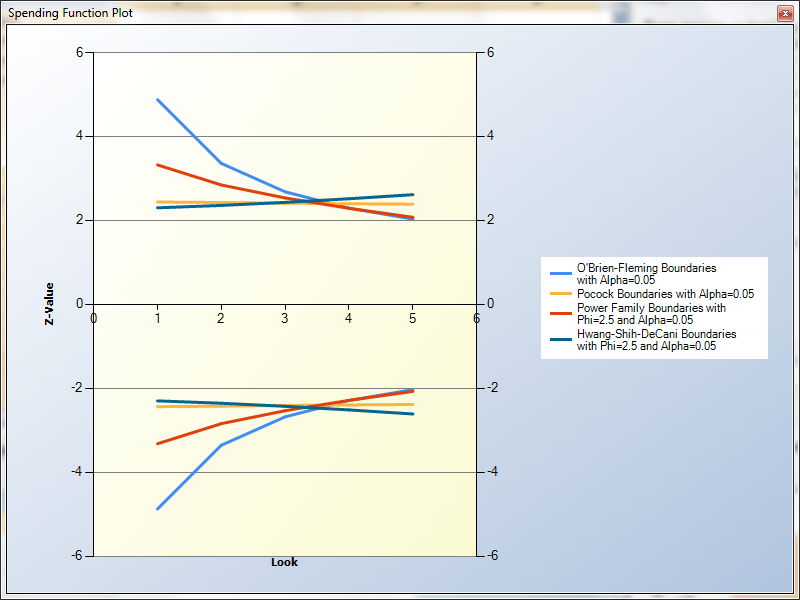
  • Group-Sequential Tests for Hazard Rates, Means, and Proportions (Superiority and Non-Inferiority)
  • GEE Tests for Means, Proportions, and Poisson Rates in a Cluster-Randomized Design
  • Post-Marketing Surveillance for Poisson Rates
  • Tests for Means and Proportions a Split-Mouth Design
  • Confidence Intervals in Cluster and Stratified Designs
  • Tests for Means and Proportions in Cluster-Randomized Designs
  • Tests for Multiple Proportions and Poisson Rates
  • Tests for One Exponential Hazard Rate
 
  • Equivalence Tests for the Ratio of Two Means (Normal Data)
  • Updated Randomization Lists (Block Randomization and Stratified Lists)
  • Updated Conditional Power and Sample Size Re-estimation of Means, Proportions, 2×2 Cross-Over Designs, and Logrank Tests
  • Updated One-Way ANOVA
  • Updated Simplified Simulation Procedures for One Mean, Paired Means, Two Means, and Mann-Whitney Tests
  • Updated McNemar Test
  • Updated Cochran-Mantel-Haenszel Test

For the 11 new group-sequential sample size procedures in PASS , there are corresponding group-sequential analysis and sample-size re-estimation procedures in NCSS


New Features in PASS

PASS adds over 55 new sample size procedures.

New Procedures


Logistic Regression

  • Tests for the Odds Ratio in Logistic Regression with One Normal X (Wald Test)
  • Tests for the Odds Ratio in Logistic Regression with One Normal X and Other Xs (Wald Test)
  • Tests for the Odds Ratio in Logistic Regression with One Binary X and Other Xs (Wald Test)


Repeated Measures Slopes (GEE)

  • GEE Tests for the Slope of Two Groups in a Repeated Measures Design (Continuous Outcome)
  • GEE Tests for the Slope of Two Groups in a Repeated Measures Design (Binary Outcome)
  • GEE Tests for the Slope of Two Groups in a Repeated Measures Design (Count Outcome)
  • GEE Tests for the Slope of Multiple Groups in a Repeated Measures Design (Continuous Outcome)
  • GEE Tests for the Slope of Multiple Groups in a Repeated Measures Design (Count Outcome)


Repeated Measures Time-Averaged Differences (GEE)

  • GEE Tests for the TAD of Two Groups in a Repeated Measures Design (Continuous Outcome)
  • GEE Tests for the TAD of Two Groups in a Repeated Measures Design (Binary Outcome)
  • GEE Tests for the TAD of Two Groups in a Repeated Measures Design (Count Outcome)
  • GEE Tests for the TAD of Multiple Groups in a Repeated Measures Design (Continuous Outcome)
  • GEE Tests for the TAD of Multiple Groups in a Repeated Measures Design (Binary Outcome)
  • GEE Tests for the TAD of Multiple Groups in a Repeated Measures Design (Count Outcome)


Hierarchical Design Comparisons using Mixed Models

  • Mixed Models Tests for Two Means in a 2-Level Hierarchical Design (Level-2 Randomization)
  • Mixed Models Tests for Two Means in a 2-Level Hierarchical Design (Level-1 Randomization)
  • Mixed Models Tests for Two Proportions in a 2-Level Hierarchical Design (Level-2 Randomization)
  • Mixed Models Tests for Two Proportions in a 2-Level Hierarchical Design (Level-1 Randomization)
  • Mixed Models Tests for the Slope Difference in a 2-Level Hierarchical Design with Fixed Slopes
  • Mixed Models Tests for the Slope Difference in a 2-Level Hierarchical Design with Random Slopes
  • Mixed Models Tests for Two Means in a 3-Level Hierarchical Design (Level-3 Randomization)
  • Mixed Models Tests for Two Means in a 3-Level Hierarchical Design (Level-2 Randomization)
  • Mixed Models Tests for Two Means in a 3-Level Hierarchical Design (Level-1 Randomization)
  • Mixed Models Tests for Two Proportions in a 3-Level Hierarchical Design (Level-3 Randomization)
  • Mixed Models Tests for Two Proportions in a 3-Level Hierarchical Design (Level-2 Randomization)
  • Mixed Models Tests for Two Proportions in a 3-Level Hierarchical Design (Level-1 Randomization)
  • Mixed Models Tests for the Slope Diff. in a 3-Level Hier. Design with Fixed Slopes (Level-2 Rand.)
  • Mixed Models Tests for the Slope Diff. in a 3-Level Hier. Design with Random Slopes (Level-2 Rand.)
  • Mixed Models Tests for the Slope Diff. in a 3-Level Hier. Design with Fixed Slopes (Level-3 Rand.)
  • Mixed Models Tests for the Slope Diff. in a 3-Level Hier. Design with Random Slopes (Level-3 Rand.)


2×2 Cross-Over Design – Odds Ratio

  • Tests for the Odds Ratio of Two Proportions in a 2×2 Cross-Over Design
  • Non-Inferiority Tests for the Odds Ratio of Two Proportions in a 2×2 Cross-Over Design
  • Superiority by a Margin Tests for the Odds Ratio of Two Proportions in a 2×2 Cross-Over Design
  • Equivalence Tests for the Odds Ratio of Two Proportions in a 2×2 Cross-Over Design


2×2 Cross-Over Design – Proportion Difference

  • Tests for the Difference of Two Proportions in a 2×2 Cross-Over Design
  • Non-Inferiority Tests for the Difference of Two Proportions in a 2×2 Cross-Over Design
  • Superiority by a Margin Tests for the Difference of Two Proportions in a 2×2 Cross-Over Design
  • Equivalence Tests for the Difference of Two Proportions in a 2×2 Cross-Over Design


2×2 Cross-Over Design – Ratio of Poisson Rates

  • Tests for the Ratio of Two Poisson Rates in a 2×2 Cross-Over Design
  • Non-Inferiority Tests for the Ratio of Two Poisson Rates in a 2×2 Cross-Over Design
  • Superiority by a Margin Tests for the Ratio of Two Poisson Rates in a 2×2 Cross-Over Design
  • Equivalence Tests for the Ratio of Two Poisson Rates in a 2×2 Cross-Over Design


2×2 Cross-Over Design – Generalized Odds Ratio for Ordinal Data

  • Tests for the Generalized Odds Ratio for Ordinal Data in a 2×2 Cross-Over Design
  • Non-Inferiority Tests for the Generalized Odds Ratio for Ordinal Data in a 2×2 Cross-Over Design
  • Superiority by a Margin Tests for the Gen. Odds Ratio for Ordinal Data in a 2×2 Cross-Over Design
  • Equivalence Tests for the Generalized Odds Ratio for Ordinal Data in a 2×2 Cross-Over Design

Williams Cross-Over Design – Pairwise Proportion Differences

  • Tests for Pairwise Proportion Differences in a Williams Cross-Over Design
  • Non-Inferiority Tests for Pairwise Proportion Differences in a Williams Cross-Over Design
  • Superiority by a Margin Tests for Pairwise Proportion Differences in a Williams Cross-Over Design
  • Equivalence Tests for Pairwise Proportion Differences in a Williams Cross-Over Design

Williams Cross-Over Design – Pairwise Mean Differences

  • Tests for Pairwise Mean Differences in a Williams Cross-Over Design
  • Non-Inferiority Tests for Pairwise Mean Differences in a Williams Cross-Over Design
  • Superiority by a Margin Tests for Pairwise Mean Differences in a Williams Cross-Over Design
  • Equivalence Tests for Pairwise Mean Differences in a Williams Cross-Over Design

Multiple Correlated Proportions (Stuart-Maxwell Test)

  • Tests for Multiple Correlated Proportions (Stuart-Maxwell Test)

Minimum System Requirements for NCSS

These are the computer requirements in order to run NCSS 12 Statistical Analysis Software:

  • Processor:
    • 450 MHz or faster processor
    • 32-bit (x86) or 64-bit (x64) processor
  • RAM:
    • 256 MB (512 MB recommended)
  • Operating Systems:
    • Windows XP with Service Pack 2 or higher
    • Windows Vista
    • Windows 7
    • Windows 8 and 8.1
    • Windows 10 or later
    • Windows Server 2003
    • Windows Server 2008
    • Windows Server 2008 R2
    • Windows Server 2012
    • Windows Server 2012 R2 or later
  • Privileges:
    • Administrative rights required during installation only
  • Third Party Software:
    • Microsoft .NET 3.5 SP1 (included with NCSS CD, comes pre-installed with Windows 7 and Windows Server 2008 R2, feature activation required on Windows 8, 8.1, 10 and Windows Server 2012 and 2012 R2)
    • Microsoft Windows Installer 3.1 or higher
    • Adobe Reader® 7 or higher (required for the Help System only)
  • Hard Disk Space:
    • 160 MB for NCSS (plus space for Microsoft .NET 3.5 SP1 if not already installed)
  • Printer:
    • Any Windows-compatible inkjet or laser printer
    •  

NCSS unter MAC OS X

Für den Betrieb von NCSS unter Mac OS X ist ein Windows Emulator, wie z.B. Parallels notwendig!

Skip product gallery

Recommended

nQuery
✅ Why Choose nQuery? 📏 Optimal Sample Size – Avoid underpowered or oversized studies 💰 Cost Reduction – Save significantly on clinical trials through precise planning 📈 Greater Efficiency – Enhance the statistical power and relevance of your results 🧠 370+ Procedures – Covers a wide range of study designs and statistical tests ⚕️ Trusted in Clinical Practice – Used globally by pharma, biotech & medical research institutions 🧬 Typical Use Cases ✔️ Clinical trials (Phases I–IV) ✔️ Medical research & epidemiology ✔️ Biostatistics & public health ✔️ Pharmaceutical development ✔️ Biotechnology & regulatory trial design 🛠️ Key Features at a Glance 🔹 Calculate sample size for a wide variety of statistical tests and study designs 🔹 Perform power analysis for fixed sample sizes 🔹 Plan studies including parallel groups, crossover designs, survival analysis, non-inferiority trials, and more 🔹 Supports both classical and modern methodologies 🔹 User-friendly interface with comprehensive documentation and guidance 📌 Conclusion: nQuery – Plan with Confidence. Research with Efficiency. nQuery ensures your clinical study is neither underpowered nor over-resourced. That means more reliable results, better decision-making, and optimized resource use. Get your study design right from the start—with nQuery. 📥 Discover nQuery & request your free demo today! ➡ Contact us for pricing, consultation, or a personalized trial.

Price on request
GraphPad Prism
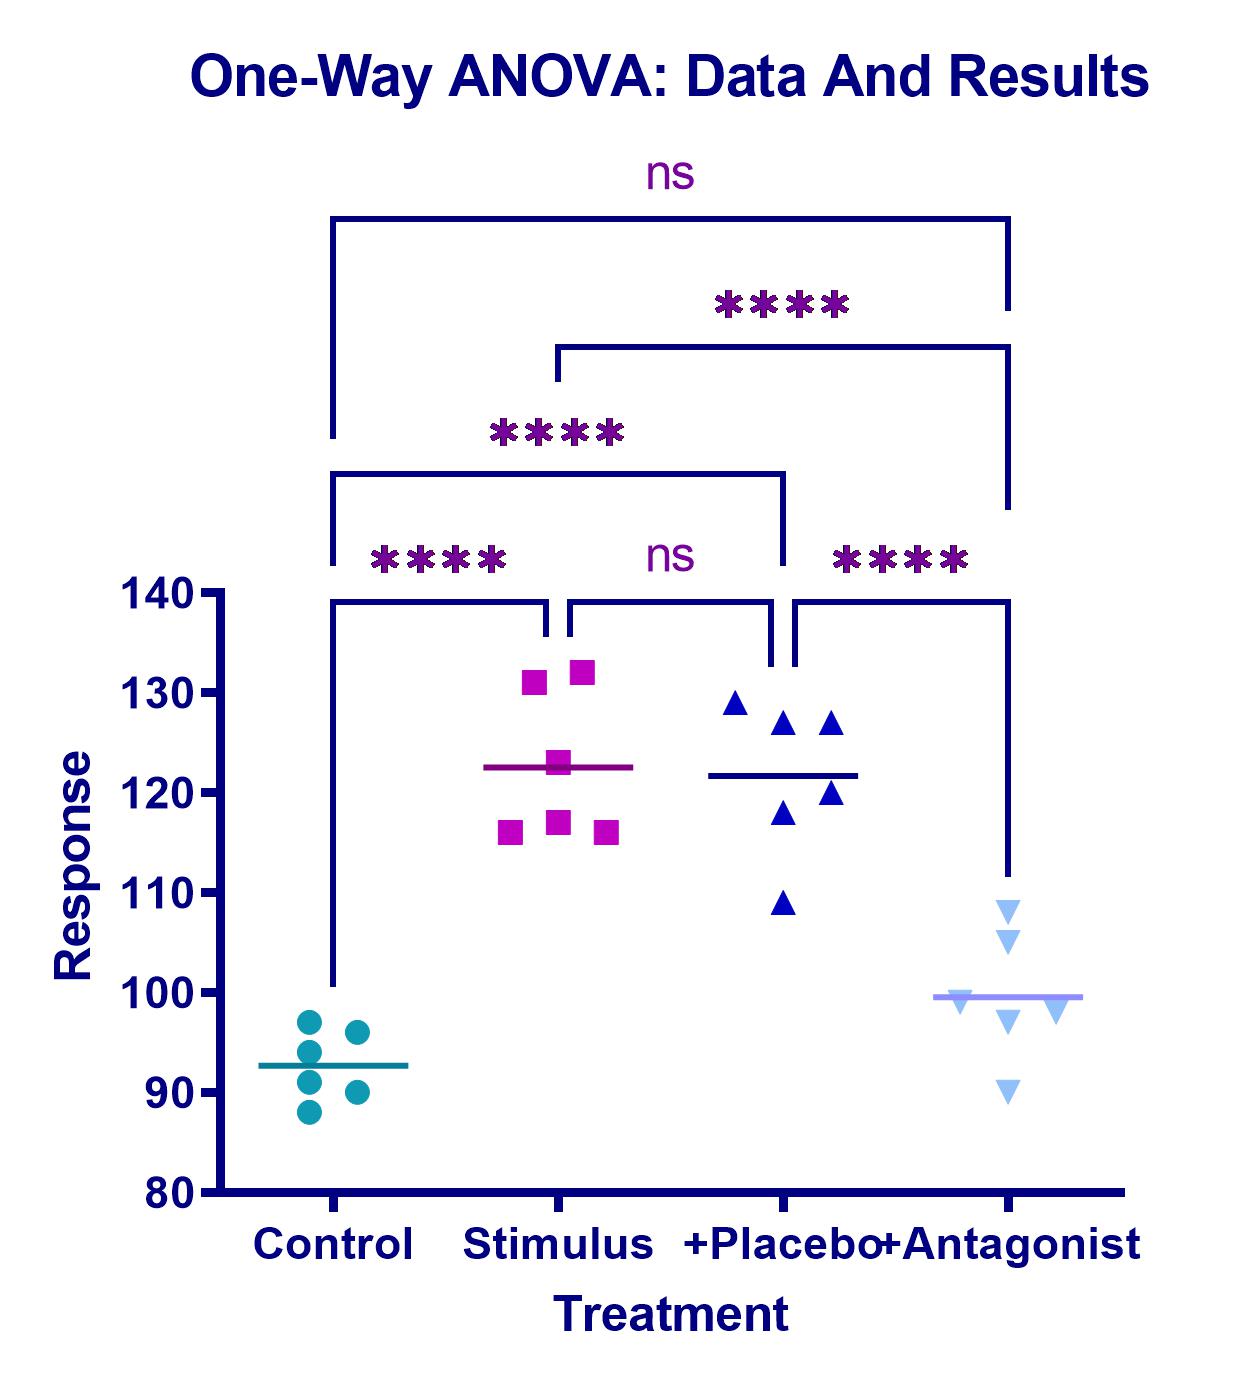
GraphPad Prism – The Leading Software for Data Analysis & Scientific Visualization GraphPad Prism is the preferred statistics and graphing software designed specifically for scientific research. Researchers around the world use Prism to perform accurate data analysis, make informed statistical decisions, and present results in professional, publication-ready charts. 🚀 Save time and improve the accuracy of your analyses with GraphPad Prism! Biostatistics & Data Analysis for Life Sciences Originally developed for biology, medicine, and pharmacology, GraphPad Prism is now widely used across the life sciences—from students and PhD researchers to scientists in the pharmaceutical and healthcare industries. ✅ Easy-to-use statistical analysis tools for scientists ✅ Automated graphing for accurate data visualization ✅ Clear, easy-to-understand results interpretation 📌 No other software offers such intuitive and powerful curve fitting! Powerful Statistical Tools in GraphPad Prism GraphPad Prism includes a wide range of statistical tests and regression models to help you analyze your research data precisely and confidently. Included Statistical Methods: 📊 t-tests (unpaired & paired) 📊 ANOVA (one-way, two-way, three-way) 📊 Nonparametric tests 📊 Linear & nonlinear regression 📊 Survival analysis (Kaplan-Meier) 📊 Contingency table analysis 💡 Especially for nonlinear regression, Prism offers advanced tools to calculate EC50, fit complex models, and compare curves with ease. Scientific Graphing with Flexible Chart Customization With GraphPad Prism, you can create high-quality scientific graphs that update automatically when your data changes. 🎨 Graphing Highlights: ✅ Automatically generated graphs based on your analyses ✅ Fully customizable axes, colors, labels, and layouts ✅ One-click templates for professional, consistent output 📈 Create perfect scientific visuals in just a few clicks! Why Choose GraphPad Prism? 🔹 Fast & easy data analysis for scientists 🔹 Automated statistics and charting for accurate research 🔹 Comprehensive tools for biostatistics & nonlinear regression 🔹 Intuitive interface – perfect for students and professionals alike 🚀 Get started with GraphPad Prism and take your scientific research to the next level! 📥 Download your free trial now: ➡ Learn more & get the free trial

Price on request
GraphPad Prism - Introduction
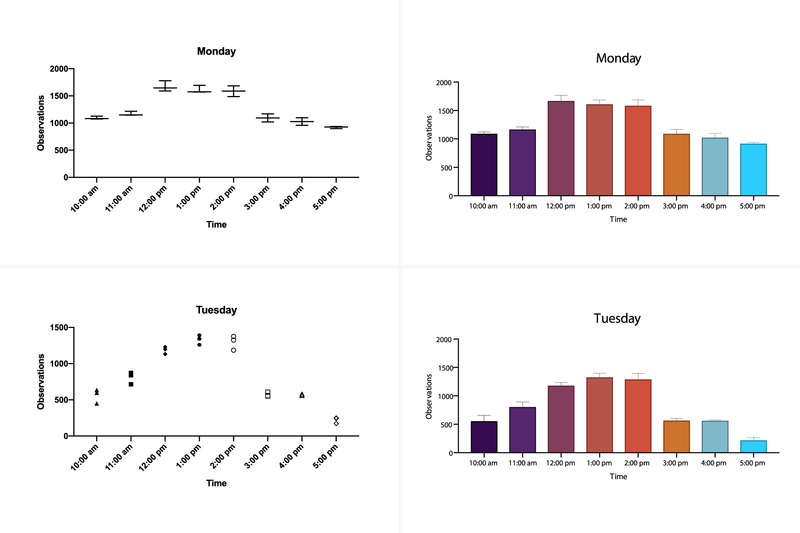
Course: Introduction to GraphPad Prism – Fundamentals of Data Analysis for Beginners In this two-day training, you will gain a solid foundation for working with GraphPad Prism, one of the leading tools for data analysis and visualization in biomedical research. You will learn the complete process of data analysis, from data acquisition to result interpretation. This course is ideal for beginners with no experience in PRISM, as well as for advanced users who want to refresh their knowledge. After the course, you will be able to use the PRISM environment confidently and conduct data analyses independently. You will be able to identify and interpret key metrics of the analysis. Course content: Day 1: Basics of GraphPad Prism 📊 PRISM Interface and Project Types 📊 Data Handling in PRISM: Formats, data entry, and import 📊 Descriptive Statistics: Tables and basic analysis 📊 Creating and Designing Graphs: Different types of charts such as bar charts, scatter plots, box plots, and Kaplan-Meier plots 📊 Graphs for Paired Samples (Before-After, Repeated Measures Graphs) 📊 Visualizing Variability in Graphs: Error bars, standard deviation (SD), confidence intervals (CI) 📊 Exporting Results: Exporting graphs and layouts to PowerPoint and Word Day 2: Statistical Analysis with GraphPad Prism 📊 Mean Comparisons: Performing t-tests, one-way ANOVA, and non-parametric tests 📊 Post-Tests: Selection and execution 📊 XY Projects: Creating dose-response curves, performing regressions, and interpreting the results 📊 Using Post-Tests and Statistical Tools in GraphPad Prism Requirements: No prior knowledge required – the course is ideal for beginners and anyone who needs a refresher. 🕒 Course Duration: 2 days 🔹 Sign up now and improve your analysis skills with GraphPad Prism!

Price on request