Skip to main content Skip to search Skip to main navigation
Menu

Minitab

Minitab is a powerful statistical software for quality improvement and Six Sigma processes.
Description

Product information "Minitab"

Minitab is a powerful statistical software for statistical analysis of data e.g. in research and quality management. Using an interactive wizard, the program offers a comprehensive range of statistical methods and graphical tools allowing to perform safely and successfully the steps of an analysis. Therefore, it is useful for industry, research, development and teaching.

The system environment facilitates the steps from data import to 2D and 3D data visualization up to data exploration and analytical statistics. The project management, reporting and documentation of the results are logical and flexible to handle.

Minitab is used worldwide for the implementation of Six Sigma projects and provides standard statistical methods, ANOVA, regression, quality tools, quality control charts, life cycle and reliability analysis, measurement system analysis, process capability analysis, design of experiments (DoE), excellent graphs and much more.

Minitab shows an extreme adaptability, supported both by the integrated programming language allowing to automate processes and by the option to compile menus individually. Thus, it is not only possible to define company-wide standards, but also to adapt Minitab to the company's needs, giving the users only those analysis at hand which is actually needed.

Arguments for Minitab:

  • Minitab offers a comprehensive range of statistical methods and graphical tools
  • Minitab supports you in all phases of a Sig Sigma process
  • Minitab is very adaptable and programmable

Minitab - The 'All-In-One' Statistical and Graphical Analysis Software Package

Minitab is one of the leading providers of statistical software and services for quality management, education and research.

Minitab provides precise but easy to use functions for quality management and general statistics. Minitab is used by plenty of leading companies like General Electric, Ford Motor Company, General Motors, 3M, Honeywell International, LG, Toshiba, Nokia and many leading Six Sigma consultants.

As an introduction to statistics, Minitab is also established in more than 4.000 technical schools and universities. Minitab's head office is located in State College, PA, USA and has branch offices in the UK, France and business partners across the whole world.

Interactive Assistant for smooth Analysis

Minitab gives you the confidence you need to improve quality, with features like an interactive assistant that guides you through your analysis. It is specifically designed to help you succeed at every step of your analysis. Once you've chosen the right tool, the assistant identifies all the steps you should take to ensure the results of your analysis are accurate and trustworthy.
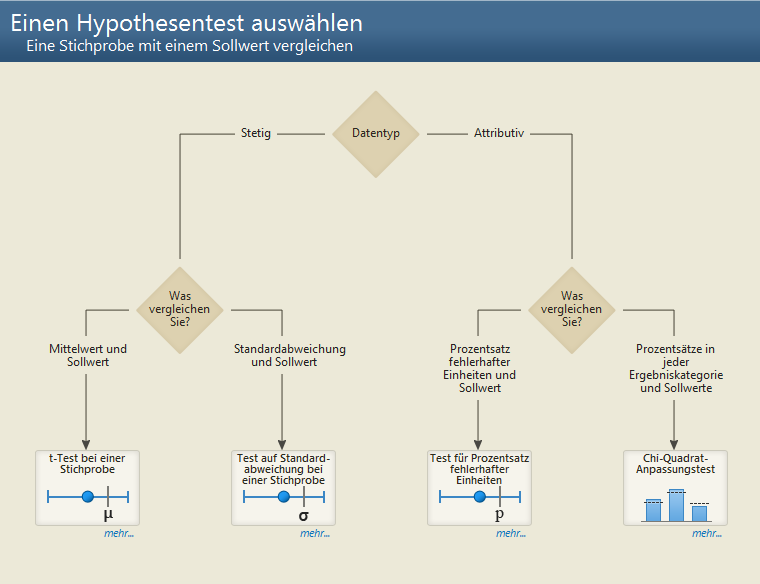

By a decision tree system you will get the right statistical tool for your analysis step by stepStep by Step Guidance
An interactive decision tree leads you to the right statistical tool by posing a series of questions you need to answer, such as the type of data you're working with and the objective of your analysis. When you face a question you can't answer, the assistant provides the information you need to respond correctly, such as the definitions of important terms and illustrated examples that help you understand how the question relates to your own data.
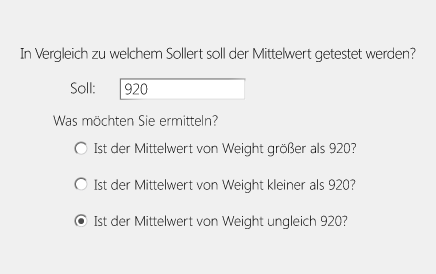
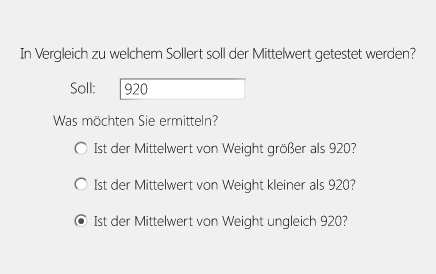
Dialogs makes it easier to insert dataDialogs helps you running analysis quick and easy
The assistant's dialogs are simple to complete. Steps have been streamlined and the text that accompanies the input fields is accessible and direct. Fields will even dynamically change based on your input.


Interpret your results with confidence
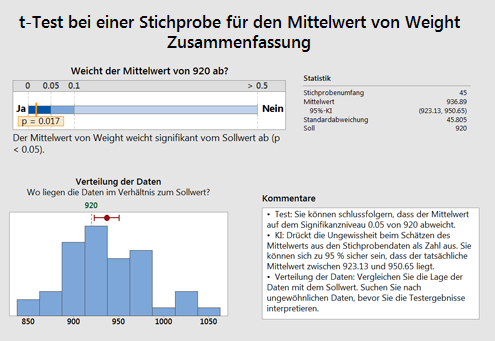
Summary reports help you draw the correct conclusions and explain why. They illustrate the answers to important questions, and include comments that give your analysis context and meaning.

Diagnostic report
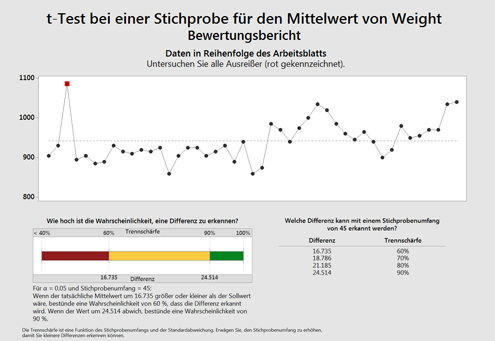
Diagnostic reports help you further understand your analysis by providing additional detail, such as outliers you should explore and the chance of detecting a significant difference.

Report card
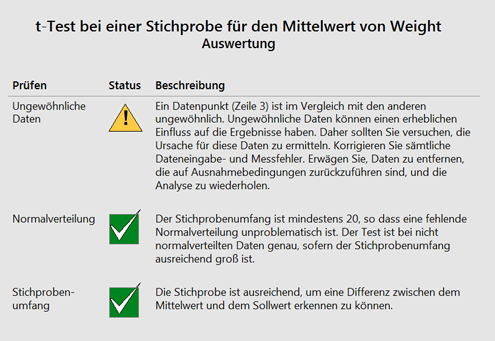
Report cards verify your analysis by providing assumption checks and identifying any concerns you should be aware of, such as unusual data points and issues with normality and sample size.

Summary of a 1-Sample t testDiagnostic Reports helping to gather significant dataThe final Report Card's are identifying weak points wihtin you analysis

Start using the software immediately!

Minitab's interface is intuitive and easy to use.
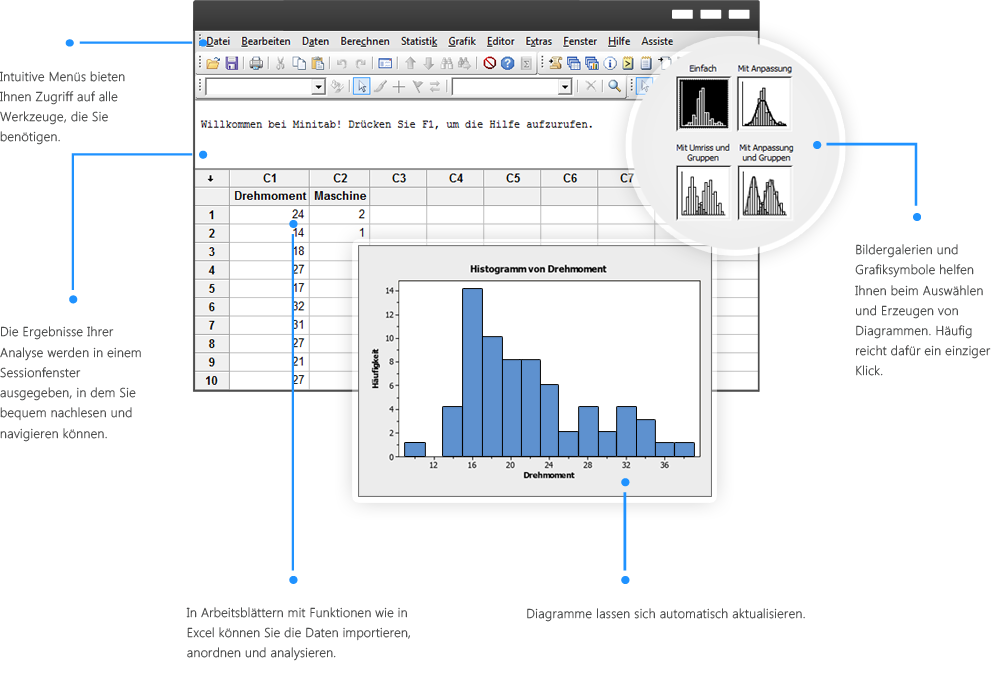
Minitab's user interface is well-arranged and user-friendly

An extensive selection of statistical methods

Basic statistics
Access a complete set of statistical tools, including descriptive statistics, hypothesis tests, confidence Intervals and normality tests.

Regression and ANOVA
Uncover the relationships between variables and identify important factors affecting the quality of your products and services.

Quality tools
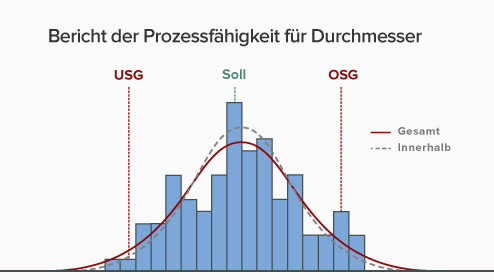
Determine if your measurement systems are adequate, assess how well your processes meet specification limits, create sampling plans, and more.

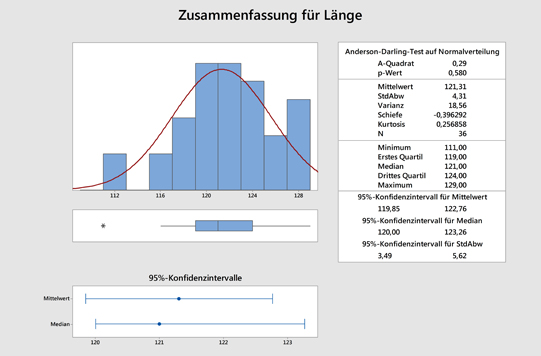
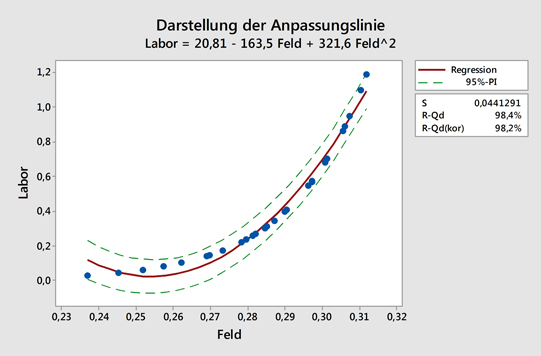
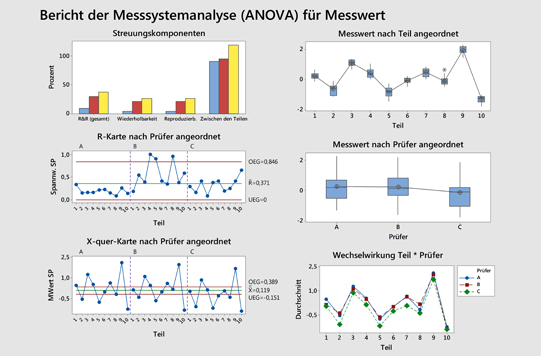
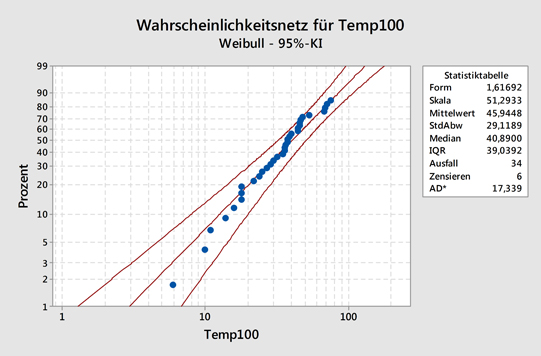
Minitab provides an extensive selection of statistical methods, here: Normality-TestRegression and ANOVA in MinitabReport of a Measurement analysis in Minitab

Design of Experiments (DoE)
Find the settings that optimize your processes using factorial, response surface, mixture and Taguchi designs.

Control charts
Monitor your processes over time and evaluate their stability.

Reliability and survival
Determine a product's lifetime characteristics using a wide range of tools including distribution analysis and accelerated life testing.

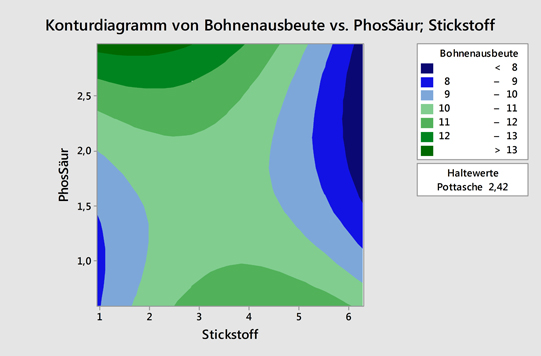
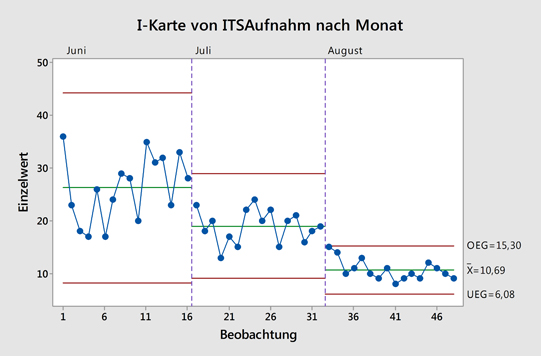
Design of Experiments in MinitabMinitab provides control charts for monitoring processes over a long period of timea probability plot in Minitab

Dig Deeper into your Data

Minitab graphs are powerful tools for investigating your process further and removing any doubt about the steps you should take to improve it.

Minitab automaticaly updates Graphs if you add or edit your dataMinitab 17

Automatically update your graphs and control charts when you add or edit data.

Select and examine points of interest, then use them to create alternate data sets and graphs.


Share your Results

Sharing your findings with colleagues is easy. Minitab's assistant automatically produces a comprehensive, straightforward summary of your analysis that includes relevant graphs and output, and how to interpret them. And there is more, Minitab's rich graphs are the building blocks of an engaging and professional presentation. They are simple to edit, and you can export them directly to MS Word and PowerPoint.

Minitab's graphics are ready for presentation

Further Information


Details

๐Ÿ“Š Minitab โ€“ Powerful Software for Statistical Analysis & Quality Management

๐Ÿ” Make Data-Driven Decisions with Minitab

Minitab is a leading statistical software solution for data analysis, visualization, predictive analytics, and quality improvement. With its intuitive interface and expert support network, Minitab empowers organizations to make accurate forecasts, improve product development, and drive sustainable successโ€”no matter the userโ€™s level of statistical knowledge.


๐Ÿš€ Why Choose Minitab?

โœ” Robust statistical tools โ€“ From regression & ANOVA to quality analysis
โœ” User-friendly & automated โ€“ Perfect for both beginners and experts
โœ” Effective data visualization โ€“ 2D and 3D charts for precise insights
โœ” Customizable & programmable โ€“ Create custom scripts and workflows tailored to your needs


๐Ÿ”ฅ New in Minitab

๐Ÿ“Œ Modernized Session Window
โž Customize views and control the number of displayed significant digits

๐Ÿ“Œ Expanded Statistical Capabilities
โž Enhanced GLM target optimization and REML for mixed models

๐Ÿ“Œ Improved Worksheet Management
โž Sort projects by title or date for better navigation and organization


๐Ÿญ Minitab for Quality Management & Process Optimization

Minitab is a trusted tool for Six Sigma, Lean Manufacturing, and quality control. Organizations benefit from:
โœ… Process capability analysis and control charts for quality assurance
โœ… Measurement System Analysis (MSA) and Design of Experiments (DoE) for in-depth process evaluation
โœ… Reliability and survival analysis to improve products and services


๐Ÿ”ฌ Minitab for Research, Industry & Education

๐ŸŽ“ Ideal for academic use โ€“ A top choice for statistics education and research
๐Ÿข Essential for business โ€“ Supports data-driven decisions across industries
๐Ÿ“ˆ Used worldwide โ€“ From quality management to product innovation


โš™๏ธ Customizable & Programmable with Minitab

๐Ÿ–ฅ Flexible automation โ€“ Use custom scripts and menus for streamlined workflows
๐Ÿข Standardize across teams โ€“ Create company-specific analysis menus
๐Ÿš€ Boost efficiency โ€“ Automate repetitive tasks and optimize processes


๐ŸŽฏ Conclusion: Why Minitab?

โœ” Complete suite of statistical tools & quality improvement features
โœ” Full support for all phases of Six Sigma and Lean projects
โœ” Highly customizable and programmable for your business needs


๐Ÿ“ข Discover Minitab today and make smarter, data-driven decisions!

โžก Learn more and start your free trial

Requirements

Minitab

  • Betriebssystem Windowsย 7 SPย 1 oder hรถher, Windowsย 8 oder 8.1, Windowsย 10
  • RAM 2 GB
  • Prozessor Intelยฎ Pentiumยฎย 4 oder AMD Athlonโ„ข Dual Core mit SSE2-Technologie
  • Speicherplatz auf Festplatte 2 GB oder mehr verfรผgbarer Speicherplatz
  • Bildschirmauflรถsung 1024 x 768 oder hรถher
  • Konnektivitรคt Fรผr die Aktivierung von Einzelplatzlizenzen ist eine Internetverbindung erforderlich.
  • Browser Internet Explorerย 9.0 oder hรถher, Microsoft Edge, Chrome oder Firefox ist fรผr die Minitab-Hilfe erforderlich.

Microsoft Visual C++ 2013 Redistributable (x86) sind erforderlich und werden mit der Anwendung installiert.

Lizenzmanager fรผr Netzwerklizenzen

Fรผr Installationen mit Netzwerklizenzen wird auรŸerdem der Minitab-Lizenzmanager benรถtigtย (hier kรถnnen Sie รผberprรผfen, ob Sie die aktuelle Version des Lizenzmanagers verwenden). Hierfรผr gelten folgende Systemanforderungen:

  • Betriebssystem 32-Bit- und 64-Bit-Versionen von Windows Serverย 2008, Windows Serverย 2012, Windowsย 8 oder 8.1 oder Windowsย 10
  • Speicherplatz auf Festplatte 100ย MB (mindestens; abhรคngig von den Einstellungen fรผr die Protokolldatei)
  • Konnektivitรคt Mindestens eine aktivierte Netzwerkkarte


Skip product gallery

Recommended

Tip
Design-Expert
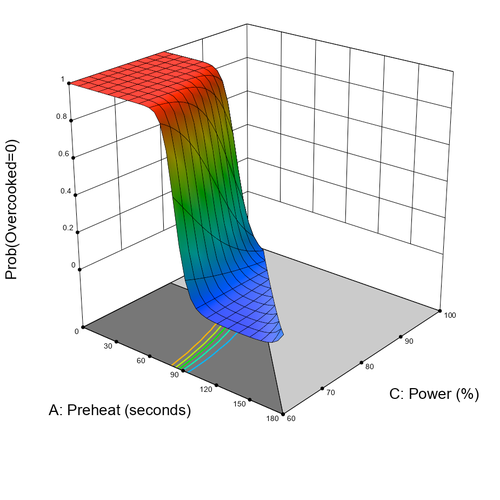
Design-Expertยฎ โ€“ The User-Friendly Software for Design of Experiments (DOE) Design-Expert is a powerful design of experiments (DOE) software that combines an easy-to-use, intuitive interface with the latest techniques in multifactorial data analysis. The software guides you through all classic DOE phases: screening, optimization (RSM), and validation. With Design-Expert, you save time and costs in product development while improving process conditions. Why Choose Design-Expert? โœ… Interactive 3D visualizations & contour plots โ€“ Quickly and easily identify optimization potential โœ… Versatile experimental designs โ€“ From classic designs to split-plot and mixture designs โœ… Multivariate optimization โ€“ Optimize multiple response variables simultaneously โœ… Excel export โ€“ Objective functions can be exported directly as formulas โœ… Propagation of error analysis โ€“ Find robust settings for your processes Features of Design-Expert ๐Ÿ“Š Rotatable 3D surface plots โ€“ Perfect for visualizing response surfaces ๐Ÿ“Š Interactive contour & ternary plots โ€“ For precise process and formulation optimization ๐Ÿ“Š All classic design types โ€“ Including D-optimal screening designs and I-optimal designs for RSM ๐Ÿ“Š Definitive screening & split-plot designs โ€“ Ideal for hard-to-change factors ๐Ÿ“Š Mixture & combined designs โ€“ Perfect for chemistry, pharmaceuticals, and formulation development ๐Ÿ“Š Optimization platform with numerical optimization โ€“ Automatically calculates the best factor settings Perfect for: โœ”๏ธ Research & Development โœ”๏ธ Chemical and pharmaceutical applications โœ”๏ธ Process optimization & quality control โœ”๏ธ Formulation & recipe development Download Design-Expertยฎ โ€“ Free Demo! Try Design-Expert, the powerful DOE software, for free! The trial version is available for download on the Stat-Ease website. ๐Ÿ”น Test all features โ€“ Experience the full power of screening, optimization (RSM), and validation ๐Ÿ”น Intuitive user interface โ€“ Simple operation for fast results ๐Ÿ”น Optimize formulations & processes โ€“ Ideal for research, development, and quality assurance ๐Ÿ“ฅ Download your free demo now: โžกย Design-Expert Trial Version

Price on request
Analyse-it
๐Ÿงฎ Analyse-it: The Powerful Excel Add-In for Statistics & Clinical Research ๐Ÿ“Š Professional Statistical Analyses Directly in Excel Analyse-it is a powerful statistics add-in for Excel that integrates seamlessly with Microsoft Excel. The software offers a comprehensive suite of statistical methods and charts โ€“ ideal for clinical research, scientific studies, and data analysis. ๐Ÿš€ Why Choose Analyse-it? โœ” Easy integration with Excel โ€“ No separate software required. โœ” Accurate statistical analyses โ€“ Wide range of parametric & non-parametric tests. โœ” Perfect for clinical research โ€“ Specialized methods for method evaluation & validation. โœ” User-friendly & cost-effective โ€“ As powerful as expensive statistical software, but more affordable & intuitive. ๐Ÿ”ฌ Independent Statistical Functions for Maximum Accuracy Unlike standard Excel functions, Analyse-it doesn't rely on built-in tools but uses independently re-coded statistical functions. This ensures: โœ… Highest accuracy & flexibility in statistical calculations. โœ… Validatable analyses โ€“ Ideal for clinical trials & medical research. โœ… In-house validation & performance testing โ€“ Software tested for specific applications. ๐Ÿ“‰ Diverse Statistical Tests & Visualizations ๐Ÿ”น Parametric & non-parametric tests โ€“ e.g., correlations, multiple regression, ANOVA & chi-square tests. ๐Ÿ”น Data visualization โ€“ Easily create boxplots, whisker plots & other charts to analyze distributions & outliers. ๐Ÿ”น Trend analysis & data modeling โ€“ Optimal solutions for scientific & clinical research. ๐Ÿฅ Analyse-it for Clinical Research ๐Ÿ“Œ The Method Evaluation module enhances Analyse-it with specialized procedures for medical statistics & clinical research. โœ” Analyze clinical data using precise statistical methods. โœ” Generate scientific reports for medical studies & publications. ๐ŸŽฏ Conclusion: The Ideal Statistical Solution for Excel Users ๐Ÿ”น Analyse-it combines the flexibility of Excel with the power of advanced statistical software. ๐Ÿ”น Perfect for scientists, clinicians & analysts who require precise statistical methods. ๐Ÿ”น Ideal for clinical research, medical studies & scientific data analysis. ๐Ÿ“ข Try Analyse-it Now & Turn Excel into a Powerful Statistical Tool!

Price on request
Design Expert - Introduction
Learn in this two-day course how to achieve optimal results with minimal effort using statistical design of experiments (DoE). This method helps you identify statistical relationships and create precise models with as few experiments as possible. What you will learn in this course:ย โœ… Basics of statistical design of experiments (DoE) โ€“ Efficient methods for conducting experiments and analysis โœ… Two-stage experiments โ€“ Simple but powerful testing methods for informed decision-making โœ… Block factors & screening designs โ€“ Identify the most important influencing factors and analyze interactions โœ… Statistical analysis โ€“ Assess the confidence of your results with practical methods โœ… Practical application with Design-Expertยฎ โ€“ Create and analyze experimental designs step by step With many practical examples and the software Design-Expertยฎ, you will gain deep insights into efficient experimental methods. ๐Ÿ”น Sign up now and optimize your experimental design! Course: Introduction to Statistical Design of Experiments (DoE) with Design-Expertยฎ Learn in this two-day course how to conduct efficient and well-founded experiments using statistical design of experiments (DoE). The course offers a hands-on introduction to creating, analyzing, and optimizing experimental designs. Course Content:ย ๐Ÿ“Œ Two-stage factorial experimental designs โ€“ Create and analyze factorial experiments for well-founded insights ๐Ÿ“Œ Developing factorial designs โ€“ Increase the efficiency and significance of your experiments ๐Ÿ“Œ Transformations in regression models โ€“ Optimize models with adjusted data ๐Ÿ“Œ Block factors in design and analysis โ€“ Structure and refine your experimental designs ๐Ÿ“Œ Fractional factorial designs โ€“ Reduce experimental effort without missing relevant insights ๐Ÿ“Œ Expanding experimental designs โ€“ Systematically add additional experiments ๐Ÿ“Œ Graphical & statistical analysis โ€“ Use charts and statistical metrics to optimally interpret results Prerequisites:ย ๐Ÿง  Basic knowledge of statistics is helpful but not required โ€“ statistical fundamentals will be taught in the course. ๐Ÿ‘จโ€๐Ÿซ Benefit from expert knowledge and learn how to take your experimental design to the next level with Design-Expertยฎ!

Price on request
JMP - Design of Experiments
Course: Classical Experimental Design with JMP In this two-day course, you will learn the classical methods of statistical experimental design. The goal of experimental design is to efficiently answer experimental questions with a minimal number of trials. You will learn how to use factorial and fractional designs to identify relevant factors and determine the best experimental conditions. Course Content: ๐Ÿ“Š Fundamentals of statistical experimental design โ€“ Concepts and methods for efficiently designing experiments ๐Ÿ“Š Randomization, replication, and blocking โ€“ Proper application of these techniques in experiments ๐Ÿ“Š Full-factorial and fractional designs โ€“ Creation and analysis of screening plans to identify relevant factors ๐Ÿ“Š Screening designs โ€“ Determining the most important factors influencing the results ๐Ÿ“Š Response surface designs โ€“ Optimizing and visualizing the effect surfaces for modeling complex relationships ๐Ÿ“Š Custom experimental designs โ€“ Adapting experimental designs to specific requirements and questions Prerequisites: ๐Ÿ“Œ Knowledge of using JMP ๐Ÿ“Œ Basic understanding of statistical hypothesis testing, ANOVA, and regression ๐Ÿ“Œ The necessary content can be acquired in the courses "Exploratory Data Analysis with JMP" and "ANOVA and Regression with JMP" ๐Ÿ•’ Course Duration: 2 days ๐Ÿ”น Sign up now and learn how to maximize the success of your experiments with statistical experimental design!

Price on request