Biometrics
What is biometrics?
Application and development of statistical or mathematical methods in the life sciences.
Which key figures and methods do we use in our analyses
Measures for the description of one- and two-dimensional empirical distributions:
- Numerical: position and dispersion measures
- Rank statistics (median, quantiles)
graphical representations:
- Histogram, box and whisker plot, column plot with error bars (also confidence intervals)
- Scatterplot
- Kaplan-Meier Plot
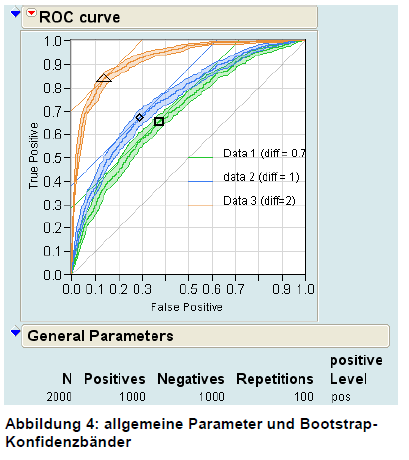
Diagnostic parameters
- Sensitivity, specificity, ROC, predictive value
Statistical estimation and testing methods
All test procedures are offered both in the asymptotic variant and by means of modern exact variants of these tests. Parametric tests t-test (dependent, independent) Simple analysis of variance Non-parametric tests Wilcoxon test, U-test Contingency table analysis Chi^2 test, McNemar test, Mantel-Haenszel test Relative risk RR, odds ratio OR Reliability, concordance Linear regression Linear model Residuals (analysis) Correlation coefficient, coefficient of determination
Study design and evaluation of studies
Study Design:
Cross-sectional, cohort, case-control, or randomized study Restriction, selection, inclusion and exclusion criteria Randomization Case number estimation Exploratory and confirmatory evaluation approaches Logistic model: odds, log odds, and odds ratio
Cox-Model:
Cutler-Ederer Kaplan-Meier estimator baseline hazard, hazard function, hazard ratio, log-rank test RR, and confidence interval.