Skip to main content Skip to search Skip to main navigation
Menu

JMP - Introduction and Exploratory Data Analysis

Ort : Inhouse
This introductory course to the JMP software covers, for example, the following topics: Importing data, data table functions, creating and editing graphs, and saving results in various formats.
Description

Product information "JMP - Introduction and Exploratory Data Analysis"

Course: Introduction to JMP – Graphical Data Analysis and Exploratory Data Analysis (EDA)
In this one-day course, you will be introduced to JMP, the powerful software for graphical data analysis. You will learn how to conduct exploratory data analysis (EDA) and identify patterns in your data.

The course will teach you not only how to navigate the JMP interface, with its menus, dialogs, and reports, but also techniques for data management such as importing, exporting, and transposing data. You will also learn how to create and interpret descriptive statistics and present your results visually.

Course Content: 

📊 Data Import – Importing data from various sources into JMP
📊 Software Navigation – Efficient use of the interface, menus, and reports
📊 Data Management – Working with column and row menus, transposing and organizing data
📊 Descriptive Statistics – Creating and interpreting basic statistical metrics
📊 Graphical Data Analysis – Performing EDA techniques for pattern recognition in data
📊 Result Presentation – Exporting analysis results and creating reports

Prerequisites:
📌 No prior knowledge required

🕒 Course Duration: 1 Day

🔹 Register now and begin your journey into the world of data analysis with JMP!


Skip product gallery

Basics

Design Expert - Introduction
Learn in this two-day course how to achieve optimal results with minimal effort using statistical design of experiments (DoE). This method helps you identify statistical relationships and create precise models with as few experiments as possible. What you will learn in this course: ✅ Basics of statistical design of experiments (DoE) – Efficient methods for conducting experiments and analysis ✅ Two-stage experiments – Simple but powerful testing methods for informed decision-making ✅ Block factors & screening designs – Identify the most important influencing factors and analyze interactions ✅ Statistical analysis – Assess the confidence of your results with practical methods ✅ Practical application with Design-Expert® – Create and analyze experimental designs step by step With many practical examples and the software Design-Expert®, you will gain deep insights into efficient experimental methods. 🔹 Sign up now and optimize your experimental design! Course: Introduction to Statistical Design of Experiments (DoE) with Design-Expert® Learn in this two-day course how to conduct efficient and well-founded experiments using statistical design of experiments (DoE). The course offers a hands-on introduction to creating, analyzing, and optimizing experimental designs. Course Content: 📌 Two-stage factorial experimental designs – Create and analyze factorial experiments for well-founded insights 📌 Developing factorial designs – Increase the efficiency and significance of your experiments 📌 Transformations in regression models – Optimize models with adjusted data 📌 Block factors in design and analysis – Structure and refine your experimental designs 📌 Fractional factorial designs – Reduce experimental effort without missing relevant insights 📌 Expanding experimental designs – Systematically add additional experiments 📌 Graphical & statistical analysis – Use charts and statistical metrics to optimally interpret results Prerequisites: 🧠 Basic knowledge of statistics is helpful but not required – statistical fundamentals will be taught in the course. 👨‍🏫 Benefit from expert knowledge and learn how to take your experimental design to the next level with Design-Expert®!

Price on request
Minitab
Minitab is a powerful statistical software for statistical analysis of data e.g. in research and quality management. Using an interactive wizard, the program offers a comprehensive range of statistical methods and graphical tools allowing to perform safely and successfully the steps of an analysis. Therefore, it is useful for industry, research, development and teaching.The system environment facilitates the steps from data import to 2D and 3D data visualization up to data exploration and analytical statistics. The project management, reporting and documentation of the results are logical and flexible to handle.Minitab is used worldwide for the implementation of Six Sigma projects and provides standard statistical methods, ANOVA, regression, quality tools, quality control charts, life cycle and reliability analysis, measurement system analysis, process capability analysis, design of experiments (DoE), excellent graphs and much more.Minitab shows an extreme adaptability, supported both by the integrated programming language allowing to automate processes and by the option to compile menus individually. Thus, it is not only possible to define company-wide standards, but also to adapt Minitab to the company's needs, giving the users only those analysis at hand which is actually needed.Arguments for Minitab:Minitab offers a comprehensive range of statistical methods and graphical toolsMinitab supports you in all phases of a Sig Sigma processMinitab is very adaptable and programmable Minitab - The 'All-In-One' Statistical and Graphical Analysis Software PackageMinitab is one of the leading providers of statistical software and services for quality management, education and research.Minitab provides precise but easy to use functions for quality management and general statistics. Minitab is used by plenty of leading companies like General Electric, Ford Motor Company, General Motors, 3M, Honeywell International, LG, Toshiba, Nokia and many leading Six Sigma consultants.As an introduction to statistics, Minitab is also established in more than 4.000 technical schools and universities. Minitab's head office is located in State College, PA, USA and has branch offices in the UK, France and business partners across the whole world.Interactive Assistant for smooth AnalysisMinitab gives you the confidence you need to improve quality, with features like an interactive assistant that guides you through your analysis. It is specifically designed to help you succeed at every step of your analysis. Once you've chosen the right tool, the assistant identifies all the steps you should take to ensure the results of your analysis are accurate and trustworthy.Step by Step GuidanceAn interactive decision tree leads you to the right statistical tool by posing a series of questions you need to answer, such as the type of data you're working with and the objective of your analysis. When you face a question you can't answer, the assistant provides the information you need to respond correctly, such as the definitions of important terms and illustrated examples that help you understand how the question relates to your own data.Dialogs helps you running analysis quick and easyThe assistant's dialogs are simple to complete. Steps have been streamlined and the text that accompanies the input fields is accessible and direct. Fields will even dynamically change based on your input.Interpret your results with confidenceSummary reports help you draw the correct conclusions and explain why. They illustrate the answers to important questions, and include comments that give your analysis context and meaning.Diagnostic reportDiagnostic reports help you further understand your analysis by providing additional detail, such as outliers you should explore and the chance of detecting a significant difference.Report cardReport cards verify your analysis by providing assumption checks and identifying any concerns you should be aware of, such as unusual data points and issues with normality and sample size.Start using the software immediately!Minitab's interface is intuitive and easy to use.An extensive selection of statistical methodsBasic statisticsAccess a complete set of statistical tools, including descriptive statistics, hypothesis tests, confidence Intervals and normality tests.Regression and ANOVAUncover the relationships between variables and identify important factors affecting the quality of your products and services.Quality toolsDetermine if your measurement systems are adequate, assess how well your processes meet specification limits, create sampling plans, and more.Design of Experiments (DoE)Find the settings that optimize your processes using factorial, response surface, mixture and Taguchi designs.Control chartsMonitor your processes over time and evaluate their stability.Reliability and survivalDetermine a product's lifetime characteristics using a wide range of tools including distribution analysis and accelerated life testing.Dig Deeper into your DataMinitab graphs are powerful tools for investigating your process further and removing any doubt about the steps you should take to improve it.Automatically update your graphs and control charts when you add or edit data.Select and examine points of interest, then use them to create alternate data sets and graphs.Share your ResultsSharing your findings with colleagues is easy. Minitab's assistant automatically produces a comprehensive, straightforward summary of your analysis that includes relevant graphs and output, and how to interpret them. And there is more, Minitab's rich graphs are the building blocks of an engaging and professional presentation. They are simple to edit, and you can export them directly to MS Word and PowerPoint. Further InformationMinitab Homepage

Price on request
R - Exploratory Data Analysis
Course: Introduction to Statistical Analysis with R In this two-day course, you will acquire the necessary skills to perform statistical analysis using R. This course is aimed at beginners who want to learn R and R-Studio and develop practical skills for data analysis. At the beginning of the course, you will receive an introduction to the basics of R and R-Studio. You will learn how to import data from various formats such as Excel, text files, and databases. Additionally, data management with dplyr will be covered so that you can effectively manipulate and analyze data. You will also be introduced to the various help functions in R to help you navigate the R environment efficiently. In the second part of the course, the focus will be on descriptive statistics in R. You will learn how to create and publish summary tables (pivot tables). The powerful ggplot2 graphics package will also be introduced, allowing you to create and export various charts such as bar charts, histograms, scatter plots, and many more. All tools and packages used in the course are free and mostly available as open-source. Course content: 🔹 Introduction to R and R-Studio – Basic operation with R 🔹 Data import – Working with Excel, text files, and databases 🔹 Data management with dplyr – Efficient data processing 🔹 Descriptive statistics with dplyr – Data overview and analysis 🔹 Graphics creation with ggplot2 – Bar charts, histograms, scatter plots, and more Prerequisites: 📌 No prior knowledge required – The course is aimed at beginners. 🕒 Course duration: 2 days 🔹 Sign up now and expand your skills in statistical analysis with R!

Price on request
EViews - Introduction
Course: Introduction to Econometrics and Time Series Analysis with EViews This two-day course introduces you to econometrics and time series analysis, showing you how to answer economic questions using statistical methods. Econometrics is a key technology for solving economic problems by combining economic theories with statistical models and datasets. With the methods learned in this course, you will be able to create simulations and forecasts for economic analysis. The focus of the course is on the linear regression model and time series analysis. You will become familiar with the statistical software EViews, which is specifically designed for econometric models and time series analysis and is easy to learn. Course Content: 📊 Introduction to the EViews Software – Basic functions 📊 Answering Econometric Questions Using Statistical Hypothesis Tests 📊 Performing Simple, Multiple, and Nonlinear Regressions 📊 Developing and Analyzing Stationary Time Series Models 📊 Creating Simulations and Forecasts with Econometric Models Requirements: 📌 Basic knowledge of statistics is helpful but not mandatory. 📌 No prior knowledge of EViews is required. 🕒 Course Duration: 2 days 🔹 Sign up now and deepen your knowledge of econometrics and time series analysis with EViews!

Price on request
GraphPad Prism
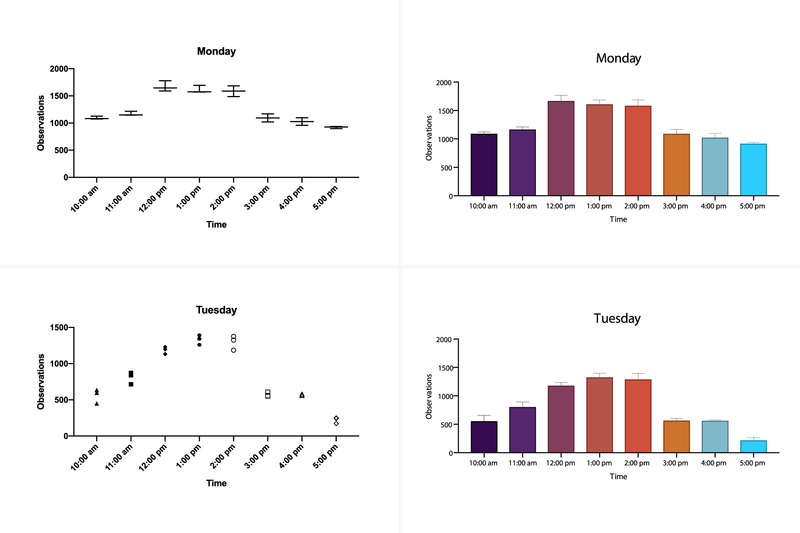
GraphPad Prism – The Leading Software for Data Analysis & Scientific Visualization GraphPad Prism is the preferred statistics and graphing software designed specifically for scientific research. Researchers around the world use Prism to perform accurate data analysis, make informed statistical decisions, and present results in professional, publication-ready charts. 🚀 Save time and improve the accuracy of your analyses with GraphPad Prism! Biostatistics & Data Analysis for Life Sciences Originally developed for biology, medicine, and pharmacology, GraphPad Prism is now widely used across the life sciences—from students and PhD researchers to scientists in the pharmaceutical and healthcare industries. ✅ Easy-to-use statistical analysis tools for scientists ✅ Automated graphing for accurate data visualization ✅ Clear, easy-to-understand results interpretation 📌 No other software offers such intuitive and powerful curve fitting! Powerful Statistical Tools in GraphPad Prism GraphPad Prism includes a wide range of statistical tests and regression models to help you analyze your research data precisely and confidently. Included Statistical Methods: 📊 t-tests (unpaired & paired) 📊 ANOVA (one-way, two-way, three-way) 📊 Nonparametric tests 📊 Linear & nonlinear regression 📊 Survival analysis (Kaplan-Meier) 📊 Contingency table analysis 💡 Especially for nonlinear regression, Prism offers advanced tools to calculate EC50, fit complex models, and compare curves with ease. Scientific Graphing with Flexible Chart Customization With GraphPad Prism, you can create high-quality scientific graphs that update automatically when your data changes. 🎨 Graphing Highlights: ✅ Automatically generated graphs based on your analyses ✅ Fully customizable axes, colors, labels, and layouts ✅ One-click templates for professional, consistent output 📈 Create perfect scientific visuals in just a few clicks! Why Choose GraphPad Prism? 🔹 Fast & easy data analysis for scientists 🔹 Automated statistics and charting for accurate research 🔹 Comprehensive tools for biostatistics & nonlinear regression 🔹 Intuitive interface – perfect for students and professionals alike 🚀 Get started with GraphPad Prism and take your scientific research to the next level! 📥 Download your free trial now: ➡ Learn more & get the free trial

Price on request