Contents: Depending on the questions and the previous knowledge of the participants, the contents will be adapted both in sequence and in time.
GraphPad Prism - Introduction
Product information "GraphPad Prism - Introduction"
Course: Introduction to GraphPad Prism – Fundamentals of Data Analysis for Beginners
In this two-day training, you will gain a solid foundation for working with GraphPad Prism, one of the leading tools for data analysis and visualization in biomedical research. You will learn the complete process of data analysis, from data acquisition to result interpretation. This course is ideal for beginners with no experience in PRISM, as well as for advanced users who want to refresh their knowledge.
After the course, you will be able to use the PRISM environment confidently and conduct data analyses independently. You will be able to identify and interpret key metrics of the analysis.
Course content:
Day 1: Basics of GraphPad Prism
📊 PRISM Interface and Project Types
📊 Data Handling in PRISM: Formats, data entry, and import
📊 Descriptive Statistics: Tables and basic analysis
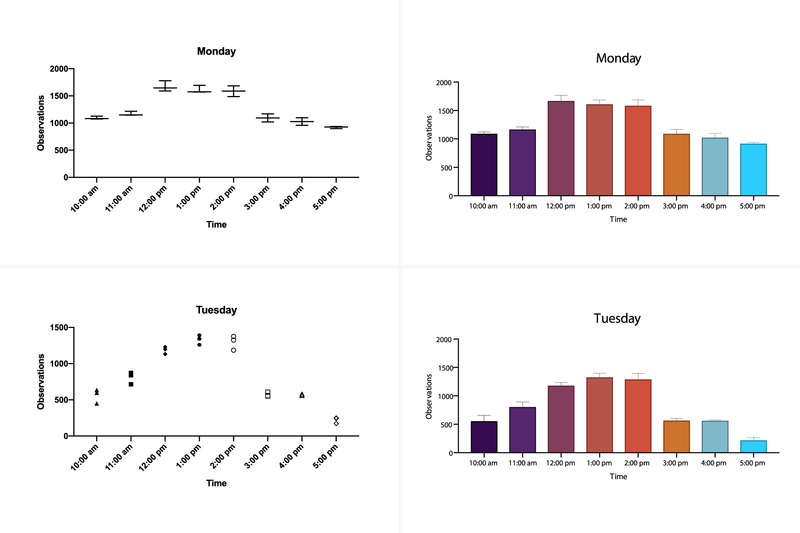
📊 Creating and Designing Graphs: Different types of charts such as bar charts, scatter plots, box plots, and Kaplan-Meier plots
📊 Graphs for Paired Samples (Before-After, Repeated Measures Graphs)
📊 Visualizing Variability in Graphs: Error bars, standard deviation (SD), confidence intervals (CI)
📊 Exporting Results: Exporting graphs and layouts to PowerPoint and Word
Day 2: Statistical Analysis with GraphPad Prism
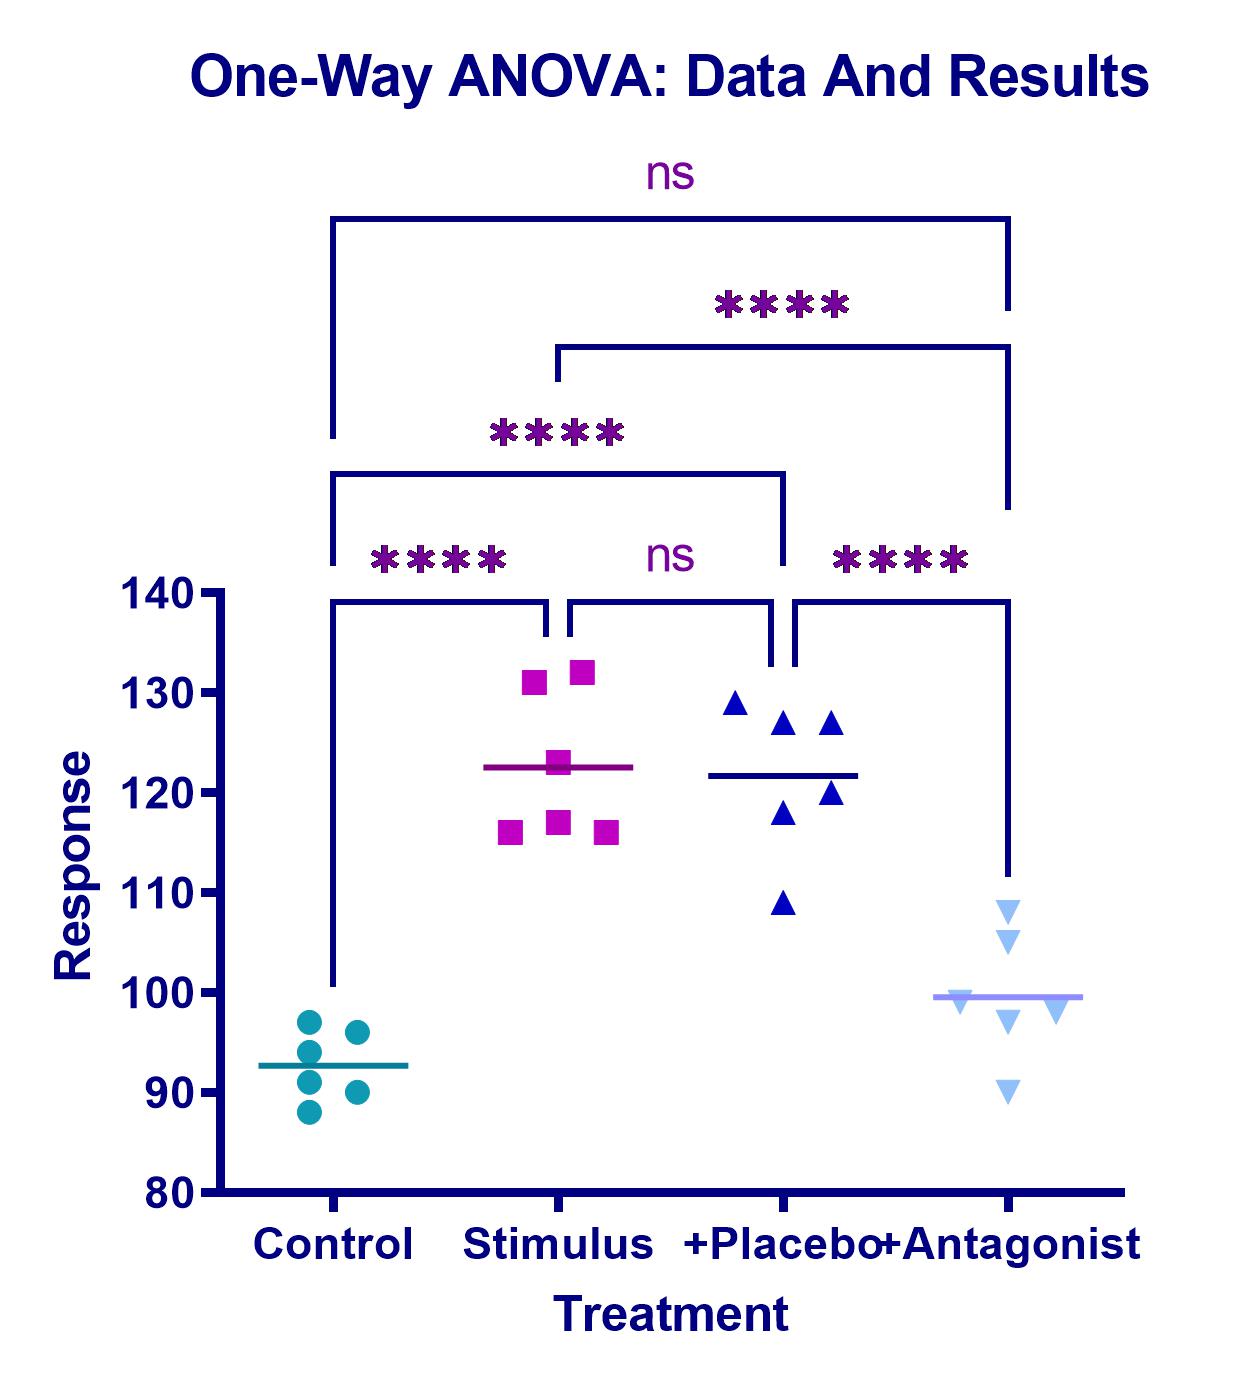
📊 Mean Comparisons: Performing t-tests, one-way ANOVA, and non-parametric tests
📊 Post-Tests: Selection and execution
📊 XY Projects: Creating dose-response curves, performing regressions, and interpreting the results
📊 Using Post-Tests and Statistical Tools in GraphPad Prism
Requirements:
No prior knowledge required – the course is ideal for beginners and anyone who needs a refresher.
🕒 Course Duration: 2 days
🔹 Sign up now and improve your analysis skills with GraphPad Prism!
Details
- Prism user interface
- Project types and welcome dialog - Getting to know different data formats
- Objects in projects
- Data handling in Prism
- Data import and preprocessing
- Creation of descriptive statistics
- Creation and design of graphs in Prism
- Which graph when? Analysis graphs or "nice" graphs? Design guidelines for graphs. Which graph belongs to which project type? Graphs for connected samples (before-after graph and repeated-measures graph)
- Grouped projects: Bar graphs (grouped and stacked) and whatever else works
- Column projects: Scatter dot plot, bar graph, and Box-and-Whisker plot. - XY projects: Scatter plots and line diagrams, area under the curve
- Visualization of scatter in graphs When standard deviation (SD), standard error of the mean (SEM) and confidence intervals (95 % CI)?
- Error bars, confidence intervals and confidence bands
- Designing the appearance of graphs: Color design with color schemes and manually
- Symbols and lines: Format Graph and Format Axes - Documenting and exporting results, summary of graphs and tables in form of layouts, exporting graphs and layouts as a file and to PowerPoint and Word
- Statistical basics
- Mean comparisons, confident use of the Prism interface - Mean comparison projects (Column and Grouped)
- Performing "Column" projects - One-sample t-test, t-test and one-way ANOVA for independent and paired samples
- Nonparametric tests for independent and paired samples
- Post-hoc tests
- Performing "XY" projects - Data entry - Dose-response curves, performing regression calculations - Interpretation of regression results
Lorem ipsum dolor sit amet, consetetur sadipscing elitr, sed diam nonumy eirmod tempor invidunt ut labore et dolore magna aliquyam erat, sed diam voluptua


