Skip to main content Skip to search Skip to main navigation
Menu

GraphPad Prism - Introduction

Ort : Inhouse
The process of data analysis from reading in the data to applying statistical techniques to the final output will be learned. The course is intended for beginners.
Description

Product information "GraphPad Prism - Introduction"

Course: Introduction to GraphPad Prism – Fundamentals of Data Analysis for Beginners

In this two-day training, you will gain a solid foundation for working with GraphPad Prism, one of the leading tools for data analysis and visualization in biomedical research. You will learn the complete process of data analysis, from data acquisition to result interpretation. This course is ideal for beginners with no experience in PRISM, as well as for advanced users who want to refresh their knowledge.

After the course, you will be able to use the PRISM environment confidently and conduct data analyses independently. You will be able to identify and interpret key metrics of the analysis.

Course content:

Day 1: Basics of GraphPad Prism
πŸ“Š PRISM Interface and Project Types
πŸ“Š Data Handling in PRISM: Formats, data entry, and import
πŸ“Š Descriptive Statistics: Tables and basic analysis
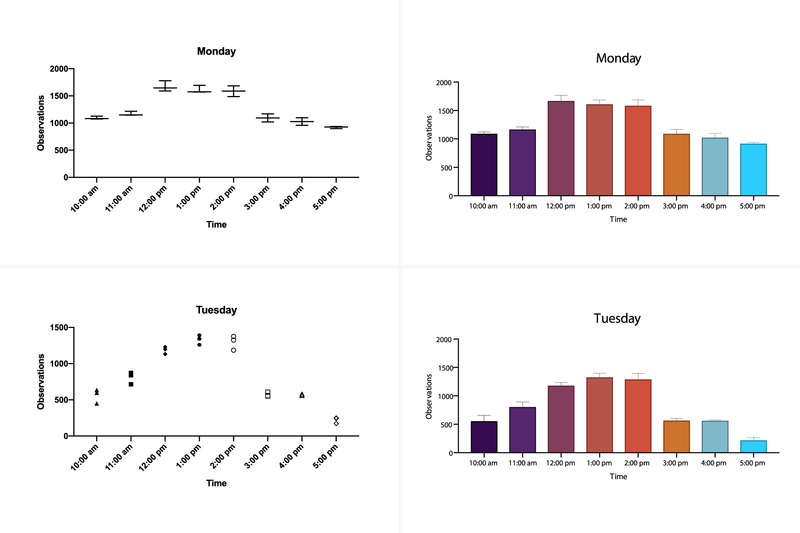
πŸ“Š Creating and Designing Graphs: Different types of charts such as bar charts, scatter plots, box plots, and Kaplan-Meier plots
πŸ“Š Graphs for Paired Samples (Before-After, Repeated Measures Graphs)
πŸ“Š Visualizing Variability in Graphs: Error bars, standard deviation (SD), confidence intervals (CI)
πŸ“Š Exporting Results: Exporting graphs and layouts to PowerPoint and Word

Day 2: Statistical Analysis with GraphPad Prism
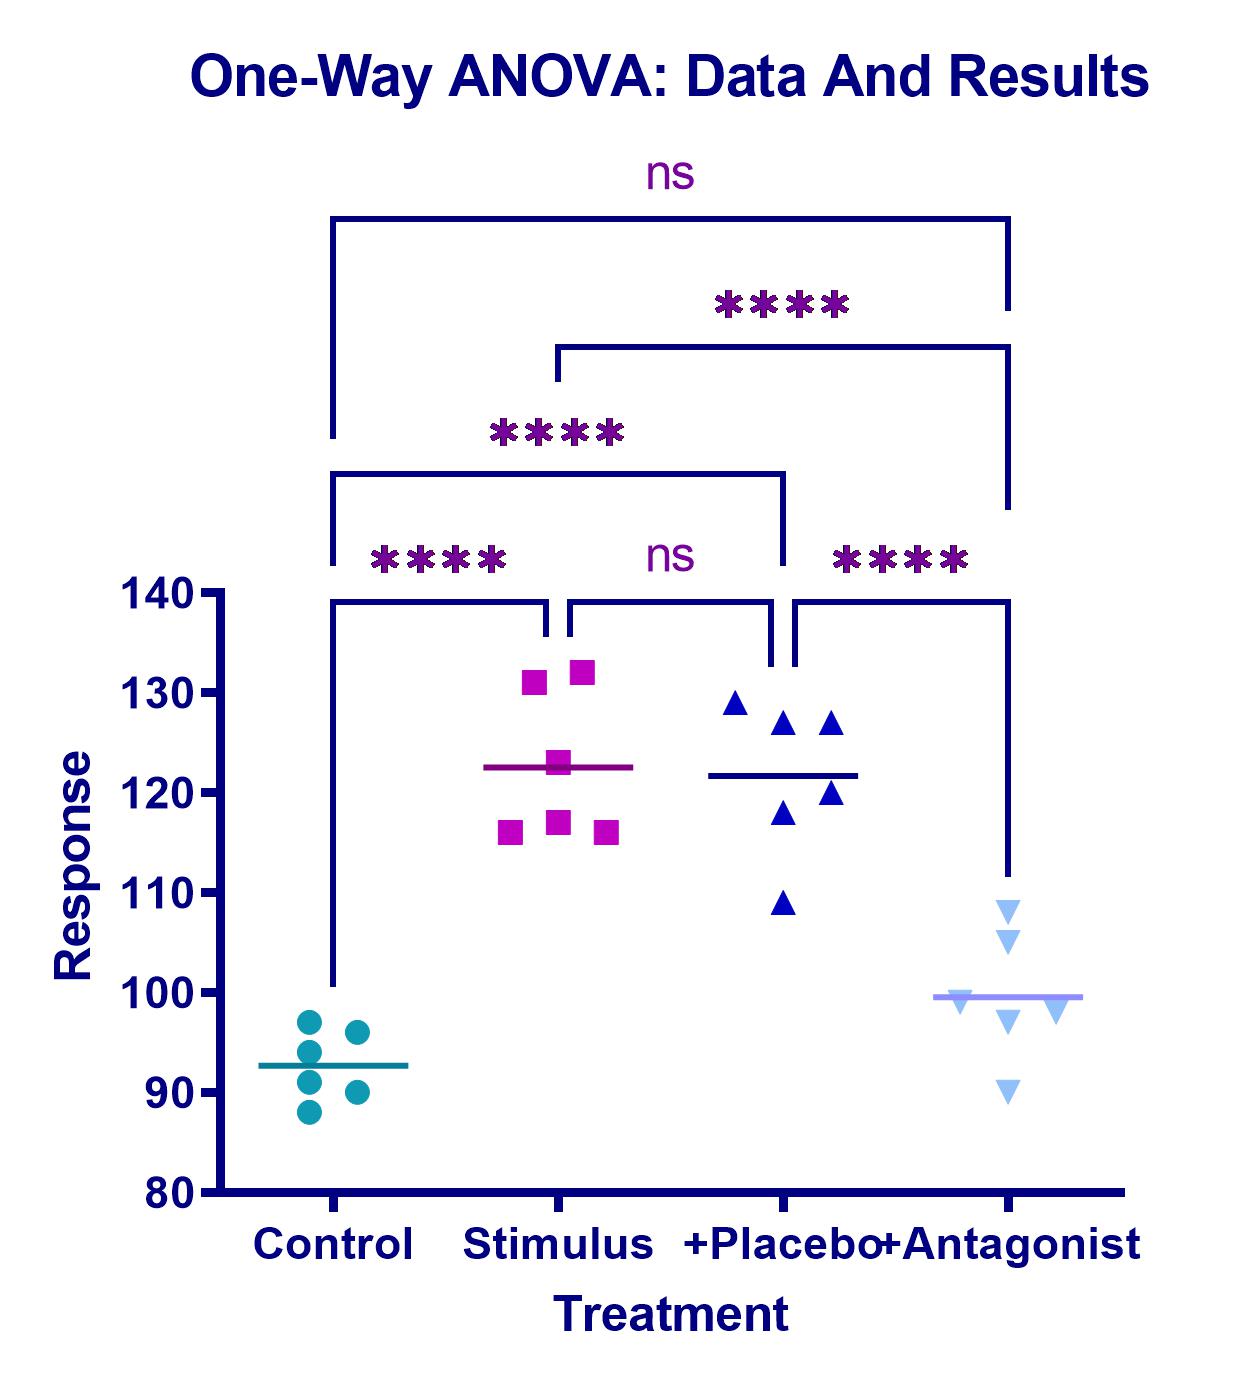
πŸ“Š Mean Comparisons: Performing t-tests, one-way ANOVA, and non-parametric tests
πŸ“Š Post-Tests: Selection and execution
πŸ“Š XY Projects: Creating dose-response curves, performing regressions, and interpreting the results
πŸ“Š Using Post-Tests and Statistical Tools in GraphPad Prism

Requirements:
No prior knowledge required – the course is ideal for beginners and anyone who needs a refresher.
πŸ•’ Course Duration: 2 days

πŸ”Ή Sign up now and improve your analysis skills with GraphPad Prism!


Skip product gallery

Life Science

GraphPad Prism - Regression
Course: Regression Analysis with GraphPad Prism – Advanced Course for Experienced Users In this 2-day advanced course, you will expand your knowledge of regression analysis with GraphPad Prism. The course focuses on linear and nonlinear regression techniques used in the analysis of biological and medical data. You will learn how to analyze and interpret dose-response curves, enzyme kinetics, and model comparisons using GraphPad Prism. The course provides in-depth knowledge of residual analysis, least squares method, model fitting, and global fitting. Course Content: πŸ“Š Statistical Foundations of Regression – Introduction to linear and nonlinear models πŸ“Š Mastering the Prism Interface – Conducting regression projects (data entry and import) πŸ“Š Linear Regression – Performing and interpreting simple linear regression models πŸ“Š Nonlinear Regression – Applying and fitting nonlinear models in Prism πŸ“Š Data Visualization – Visualizing regression data in GraphPad Prism πŸ“Š Graphs and Charts – Creating and interpreting regression graphs πŸ“Š Statistical Metrics – Interpreting regression statistics and results for your analysis Prerequisites: πŸ“Œ Basic knowledge of GraphPad Prism πŸ“Œ Statistical knowledge in regression is helpful but not required πŸ•’ Course Duration: 2 days πŸ”Ή Sign up now and enhance your skills in regression analysis with GraphPad Prism!

Price on request
GraphPad Prism
GraphPad Prism – The Leading Software for Data Analysis & Scientific Visualization GraphPad Prism is the preferred statistics and graphing software designed specifically for scientific research. Researchers around the world use Prism to perform accurate data analysis, make informed statistical decisions, and present results in professional, publication-ready charts. πŸš€ Save time and improve the accuracy of your analyses with GraphPad Prism! Biostatistics & Data Analysis for Life Sciences Originally developed for biology, medicine, and pharmacology, GraphPad Prism is now widely used across the life sciencesβ€”from students and PhD researchers to scientists in the pharmaceutical and healthcare industries. βœ… Easy-to-use statistical analysis tools for scientists βœ… Automated graphing for accurate data visualization βœ… Clear, easy-to-understand results interpretation πŸ“Œ No other software offers such intuitive and powerful curve fitting! Powerful Statistical Tools in GraphPad Prism GraphPad Prism includes a wide range of statistical tests and regression models to help you analyze your research data precisely and confidently. Included Statistical Methods: πŸ“Š t-tests (unpaired & paired) πŸ“Š ANOVA (one-way, two-way, three-way) πŸ“Š Nonparametric tests πŸ“Š Linear & nonlinear regression πŸ“Š Survival analysis (Kaplan-Meier) πŸ“Š Contingency table analysis πŸ’‘ Especially for nonlinear regression, Prism offers advanced tools to calculate EC50, fit complex models, and compare curves with ease. Scientific Graphing with Flexible Chart Customization With GraphPad Prism, you can create high-quality scientific graphs that update automatically when your data changes. 🎨 Graphing Highlights: βœ… Automatically generated graphs based on your analyses βœ… Fully customizable axes, colors, labels, and layouts βœ… One-click templates for professional, consistent output πŸ“ˆ Create perfect scientific visuals in just a few clicks! Why Choose GraphPad Prism? πŸ”Ή Fast & easy data analysis for scientists πŸ”Ή Automated statistics and charting for accurate research πŸ”Ή Comprehensive tools for biostatistics & nonlinear regression πŸ”Ή Intuitive interface – perfect for students and professionals alike πŸš€ Get started with GraphPad Prism and take your scientific research to the next level! πŸ“₯ Download your free trial now: ➑ Learn more & get the free trial

Price on request
Biometrics - Statistics for Life Science
Course: Statistics for Biological and Medical Data – Fundamentals & Practical Application This three-day course covers the basics of statistical analysis for biological and medical data. Instead of complex mathematical formulas, the focus is on practical application. Through hands-on examples, you will learn to understand and confidently apply statistical methods. The course offers a comprehensive overview of statistical analysis methods, their applications, and potential risks – ideal for beginners and professionals looking to refresh their knowledge. What you will learn in this course: πŸ“Š Statistics Fundamentals: Descriptive statistics & key metrics πŸ“Š Interpreting Statistical Graphs: Bar charts, error bars & dose-response curves πŸ“Š Hypothesis Testing & Significance Tests: t-Test, ANOVA (including Repeated Measures) πŸ“Š Nonparametric Methods: Mann-Whitney U test, Kruskal-Wallis test, Wilcoxon test, Friedman test πŸ“Š Regression Analysis: Linear & nonlinear models including dose-response curves πŸ“Š Data Validation: Data transformation, residual analysis (homogeneity of variance, normal distribution, lack-of-fit) πŸ“Š Statistical Experimental Design (Design of Experiments, DoE) πŸ“Š Survival Analysis & Models: Kaplan-Meier curves, Cox model & parametric survival models Prerequisites: βœ… No prior knowledge required – ideal for beginners & practitioners. πŸ•’ Course Duration: 3 days πŸ”Ή Sign up now and apply statistics with confidence!

Price on request