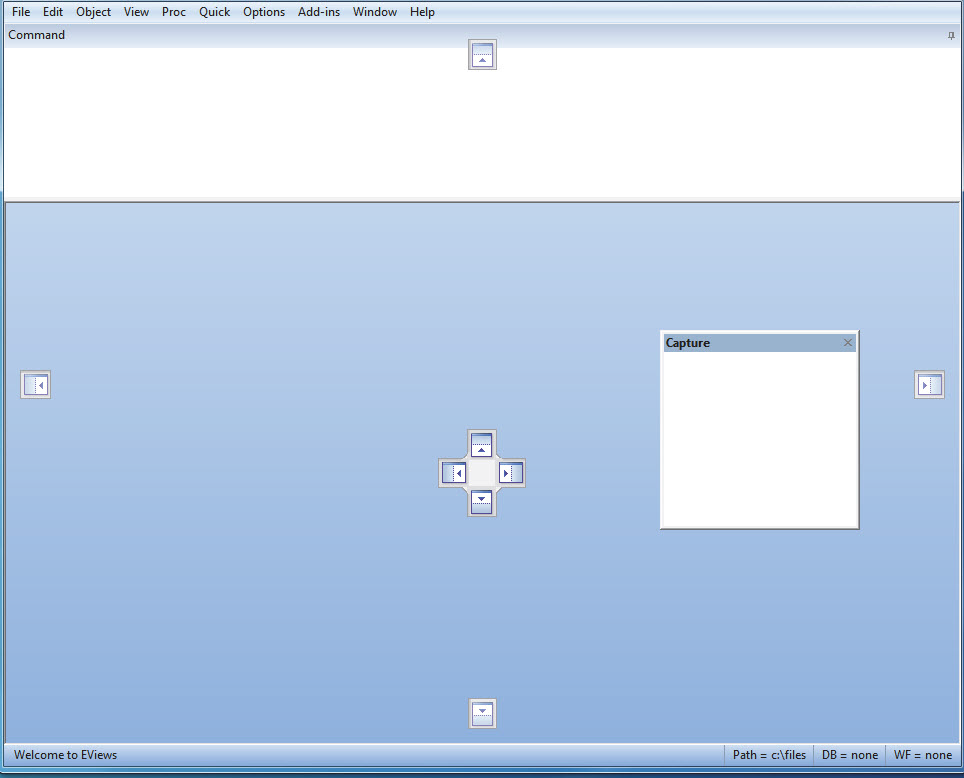
EViews
Product information "EViews"
EViews – The Leading Software for Econometrics, Time Series Analysis, and Forecasting
EViews is the top choice for financial institutions, corporations, government agencies, and academic researchers who require powerful tools for statistical analysis, time series modeling, and forecasting.
🔹 Intuitive, object-oriented interface – Easy to use for fast and efficient analysis
🔹 Powerful statistical and modeling tools – Includes ARIMA, GARCH, GLM, Monte Carlo simulations
🔹 Efficient data management – Handle and analyze time series of varying frequencies and formats
🔹 Publication-ready output – High-quality charts and tables for professional presentations and reports
📊 Harness the power of the leading econometrics software for precise analysis and reliable forecasting!
EViews – Now More Powerful and User-Friendly Than Ever
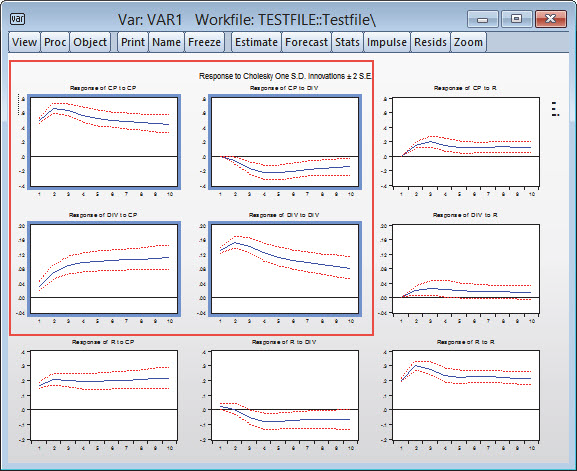
The latest version of EViews introduces advanced statistical methods, enhanced data analysis capabilities, and an improved user interface. It's the ideal tool for economists, financial analysts, and researchers working with time series, panel data, and forecasting models.
🆕 Top New Features in EViews
✔ Advanced ARDL and NARDL estimation
✔ Improved PMG and VEC models
✔ New Difference-in-Differences estimation
✔ Bayesian Time-Varying Coefficient VARs
✔ Panel cluster standard errors for robust inference
✔ Integration with Jupyter Notebook for Python users
✔ Enhanced graphics, tables, and Excel export
✔ Interfaces with R, MATLAB, World Bank, Eurostat, and more
📊 EViews remains the #1 choice for econometrics, statistics, and data analysis!
➡ Learn more: Contact
EViews – Leading Forecasting and Econometrics Software
EViews is a powerful and intuitive software solution for econometrics, time series analysis, and forecasting. Designed for researchers, companies, government agencies, and students, EViews combines advanced statistical and modeling tools with a user-friendly, object-oriented interface. It’s the ideal tool for working with time series, cross-sectional, or panel data.
With EViews, you can easily process large datasets, perform econometric and statistical analyses, generate forecasts or simulations, and create publication-quality charts and tables—all with just a few clicks and without writing complex code.
🔍 Why Use EViews?
-
✅ Powerful econometric analysis tools: ARIMA, GARCH, GLM, Monte Carlo simulations & more
-
✅ Clean, object-oriented GUI – no coding required
-
✅ Fast and efficient data handling for large time series
-
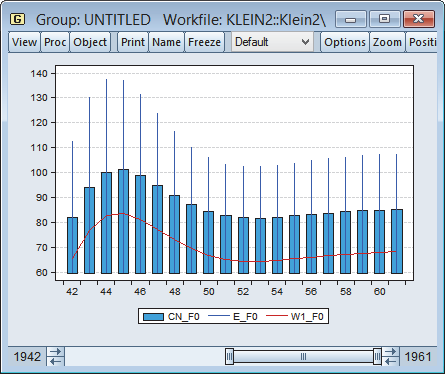
✅ High-quality visualizations: line charts, bar graphs, pie charts, scatter plots, and more
-
✅ Ideal for economic research, financial modeling, and academic analysis
-
✅ Direct data export to Excel or integration with external applications
-
✅ Seamless workflow for modeling, forecasting, and report generation
🧩 EViews Editions: Standard vs. Enterprise
EViews is available in two editions: Standard and Enterprise.
✅ Enterprise Edition Advantages:
-
ODBC Support – Connect directly to large external databases such as Oracle, SQL Server, IBM DB2, Sybase
-
Custom Database Interfaces – Use EDX (Database Extension Interface) and EDO (EViews Database Object) for proprietary data sources
-
Live Third-Party Data Integration – Import real-time data from Bloomberg, IHS Economics, FactSet, and more
-
Enhanced Big Data Capabilities – Handle and analyze large datasets effortlessly
📊 Advanced Graphing & Visualization in EViews
EViews includes a wide variety of visualization tools designed especially for time series analysis:
-
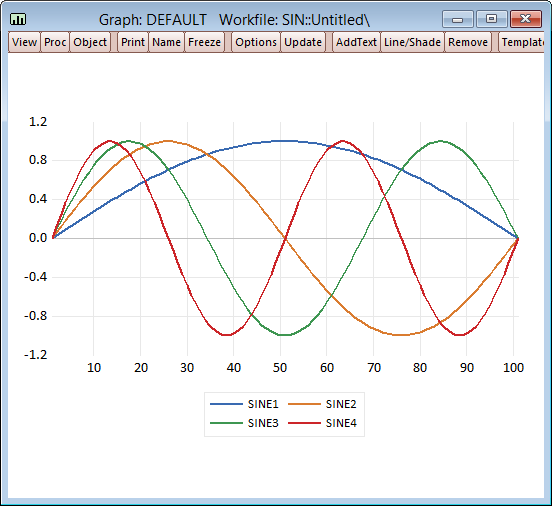
📈 Line graphs, bar charts, pie charts, scatter plots, box plots
-
🔄 Mixed graph types – Combine multiple styles into one plot
-
🗂️ Multi-graph slideshow with zoom – Navigate and compare multiple graphs seamlessly
-
🖱️ Fully interactive chart editing – Customize colors, lines, axes, legends, and annotations
-
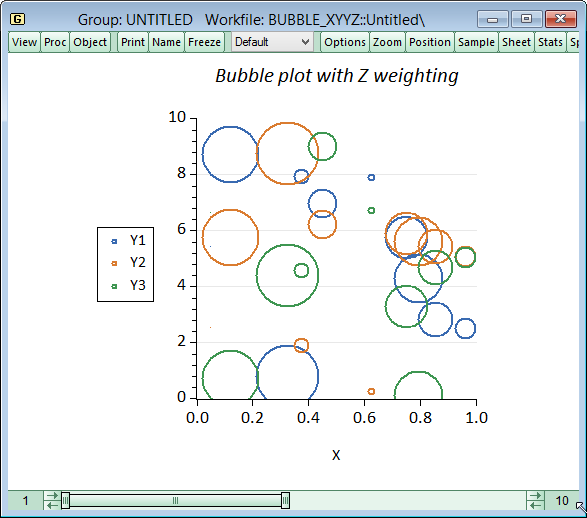
🧩 Bubble plots – Add a third dimension to scatter plots via data point size
-
🎯 Export-ready graphics – Perfect for academic papers, presentations, and reports
🔬 Key Analytical Features in EViews
-
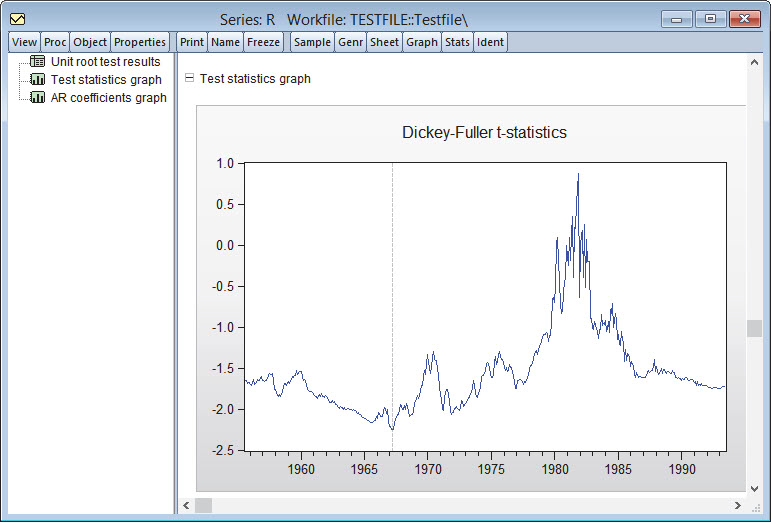
🔹 Dickey-Fuller Unit Root Test (with enhancements)
-
🔹 Mixed Graph Types – Flexible visualization of multiple variables
-
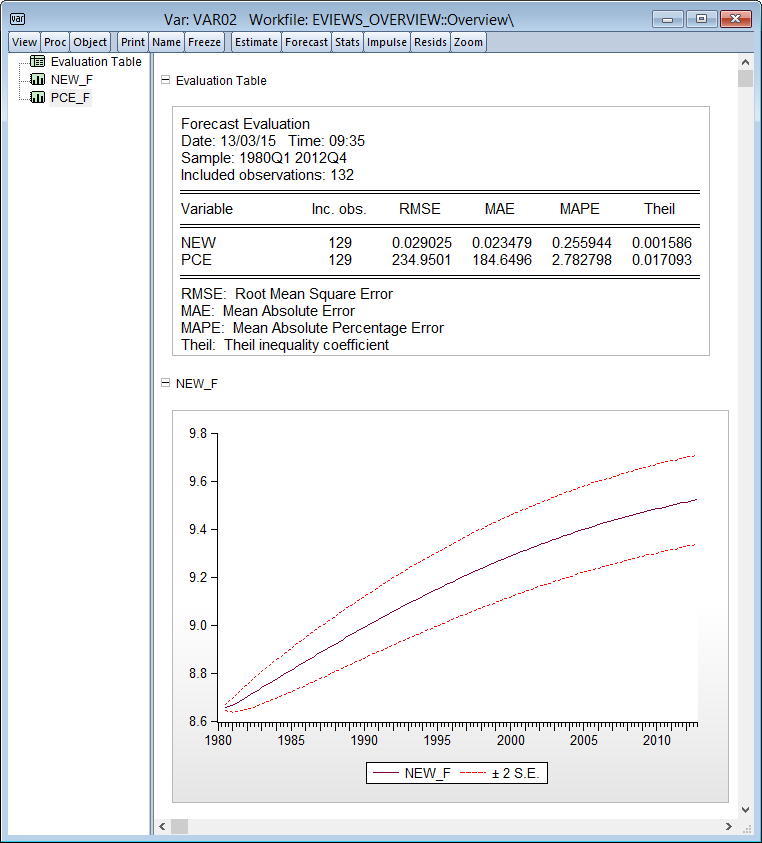
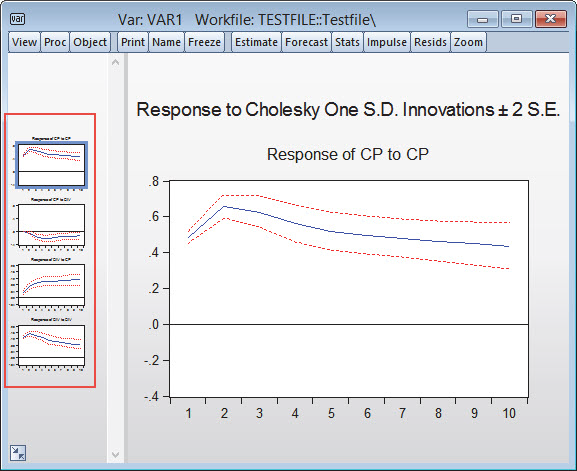
🔹 One-click forecasting directly from VAR models
-
🔹 Panel data analysis with cluster-robust standard errors
-
🔹 Bayesian time-varying coefficient VARs
-
🔹 New default graph templates with modern styling (white background, grid lines, thicker lines)
-
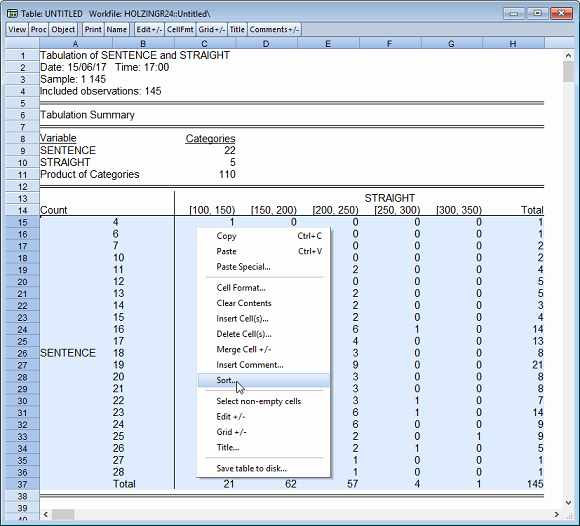
🔹 Sortable tables by single or multiple columns
-
🔹 Dynamic model simulation and scenario testing
🌐 IHS Global Link Model Integration
Gain access to the largest macroeconomic forecasting model available: the IHS Global Link Model. Analyze global economic trends in real time and assess their impact on:
-
Commodity prices
-
Exchange rates
-
Monetary and fiscal policy
-
Industry performance and more
Simulate custom scenarios with the IHS Economic Simulation Engine and export all results directly into EViews for further analysis. Expert support from IHS analytics professionals is available on demand.
💻 Additional Tools & Resources
Extend EViews’ functionality with a wide range of free downloadable Add-ins and library packages from the official IHS EViews website. Enhance your workflow with integrations to Python (Jupyter Notebooks), R, MATLAB, and various global databases (e.g., World Bank, Eurostat).
✅ EViews in a nutshell
-
Econometrics software for time series analysis and forecasting
-
Ideal for academic, corporate, and institutional users
-
Forecasting without coding
-
Real-time economic data integration
-
Panel data models and simulations
-
Easy export to Excel and powerful visualizations
-
Enhanced statistical testing and diagnostics
📥 Learn more and download the latest EViews version:
➡ Contact
| Komponente | Anforderung |
|---|---|
| CPU | Pentium oder besser |
| Betriebssystem |
|
| Arbeitsspeicher | 512 MB |
| Festplattenspeicher | 400 MB freier Speicherplatz für EViews, unterstützende Dateien, vollständige Dokumentation und Beispieldateien |

