Development
If your data and processes cannot be analyzed with standard procedures or you simply want to automate or optimize some work steps, we will be happy to support you: We derive special statistical methods and procedures for your task areas and implement them in your statistical software. In doing so, we always respond to your specific requirements and guarantee an individual solution. Our service refers to all common statistical software packages. For example, we extend your JMP software with individual scripting tools for multivariate statistics, statistical design of experiments and data analysis. Of course, we also support your staff in the implementation of our script applications.
Do you have questions about the statistical software used in your company or do you encounter problems with it? Then take advantage of our individual software coaching with our competent employees.
Multifactorial ANOVA with Shiny
With the StAT application you calculate group comparisons for any number of factors. In common commercial software like GraphPad Prism, the number of possible influencing factors is limited to a few factors. However, many experiments in the life sciences require this consideration. This application closes this gap.
- Carrying out analyses of variance with any number of factors, taking into account selected interactions
- Visualization by means of bar charts, scatter diagrams, box and violin plots, and error bars
- Model diagnostics including normal distribution tests and graphical tools
- Conduct group comparisons for Selected Factors and Interactions.
- Easy export of results tables and graphs as .csv and .pdf files
- Easy import of data in csv format
Technical details
- Individually customizable and expandable
- Platform independent web application (Windows, Mac OS, Unix, Android, iOS...)
- Responsive
- Local for single user or server version for multiple users
- Based on the free statistical software R
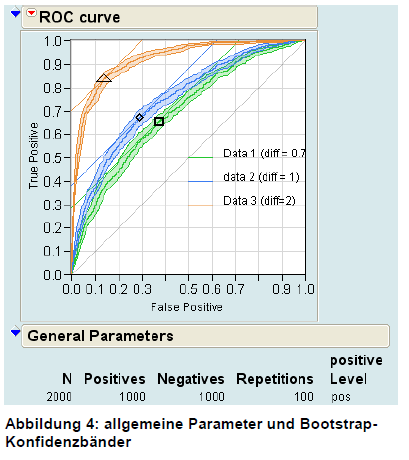
Confidence bands for ROC curves
Calculation of receiver-operator characteristic (ROC) curves in JMP: With this scripting tool, we provide our customers with an application-oriented program for calculating sensitivity and specificity , for displaying the corresponding ROC curves, and for determining the AUC value (area under the curve) in diagnostic tests. In contrast to standard solutions, our JMP script is based on the latest scientific findings and includes the calculation and display of confidence bands of the ROC curves.
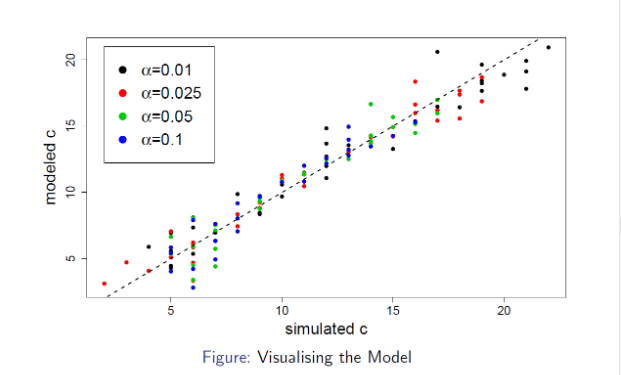
Small sample estimators
Within the framework of the DAGStat, Statcon presented the research results, which were developed in cooperation with the TU Dortmund University and the University of Ingolstadt, to the auditorium in the panel "Robust and Nonparametric Statistics". The research work developed from a problem from industry. Confidence intervals for quantiles were developed, which lead to valid results without distribution and with small samples, so that the testing effort can be significantly reduced when testing materials and batches.