Data Analysis
If you work for a year towards a sporting event and are disappointed with your own performance at the end, the question always arises as to what went wrong. As I experienced, the question also arises when you haven't prepared for the whole year, but are still disappointed with your own result.


Since the results of all participants are available on the Internet for these events, I can of course use this data excellently to justify my poorer time this year (unfortunately, age-related decline in performance is not yet a valid excuse). So let's examine the hypothesis:
Was the 2016 triathlon more difficult than the 2015 triathlon?
If we summarize the data in a simple table, the thesis seems to be confirmed:

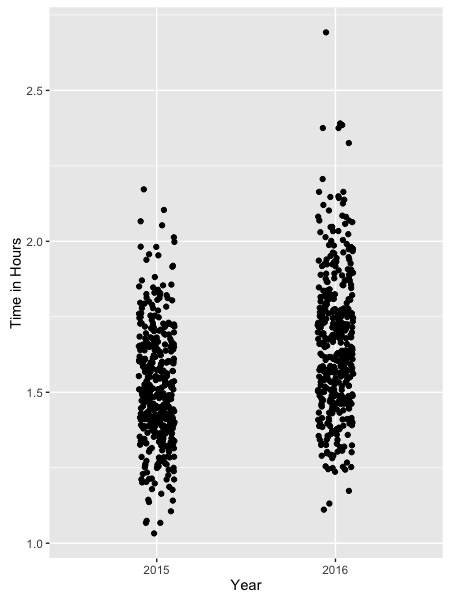
Has the 2016 triathlon really been harder than the 2015 triathlon?
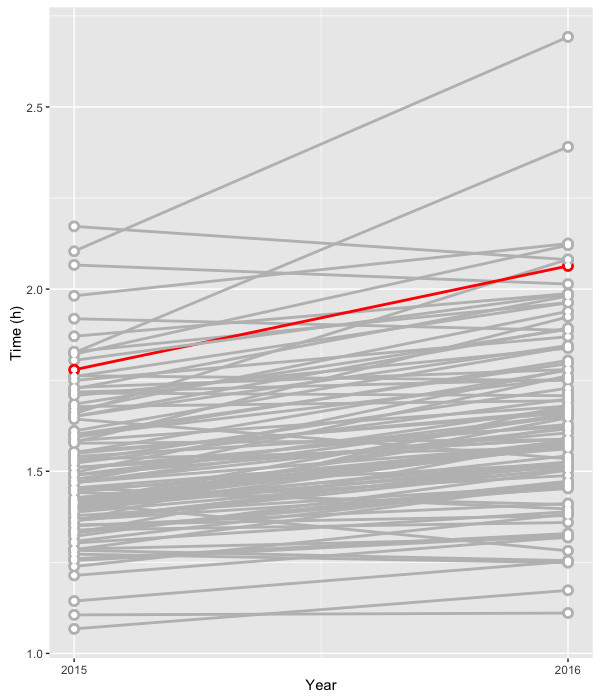
- I (red) am quite far back in the field.
- most participants were slower in 2016 than in 2015.
At this point, I don't need a statistical hypothesis test to see that something has changed from 2015 to 2016. Even without calculating the tests, I can promise you that both the two-sample t-test for the full sample and a paired-t-test for the connected sample would show a statistically significant difference. But while the 10-15 minute difference has practical relevance for me, possible test results here do not. I couldn't resist a bit of p-value-bashing at this point.
Root Cause Analysis
After finding out that there is a relevant difference between the 2 events, the next intriguing question is: why were athletes worse in 2016 than in 2015?
Was it perhaps the weather?
- Maximum temperature on 24.07.2016: 28°C
- Maximum temperature on 02.08.2015: 30°C
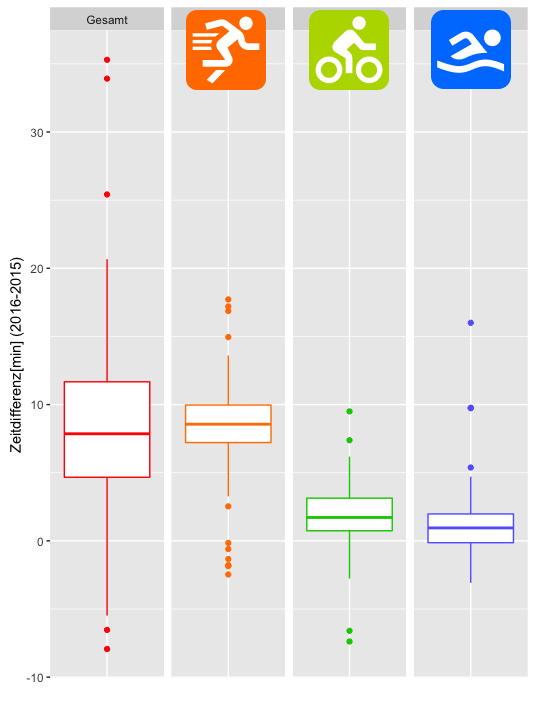
However, there was some rain in the weeks before the 2016 triathlon, which increased the water level of the Neckar and also its current. Maybe that had an influence on the swimming performances? It is certainly an interesting idea to look at the times of the participants divided by discipline.
Swimming
Typical swim times for this distance are in the 10 to 25 minute range. I assume that the 65 minutes from 2015 is an erroneous data point.
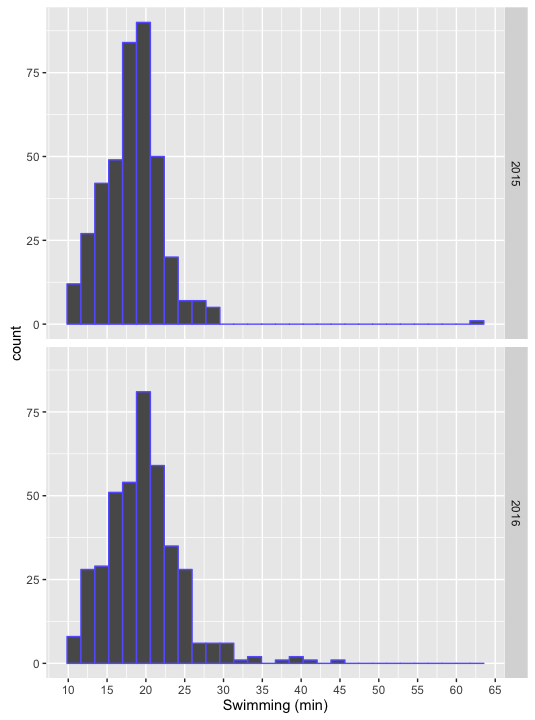
The boxplot suggests that most athletes took about 1-2 minutes longer. That would be a deterioration of about 10% for most. A possible explanation would be the stronger current of the Neckar in 2016.
Cycling
Running
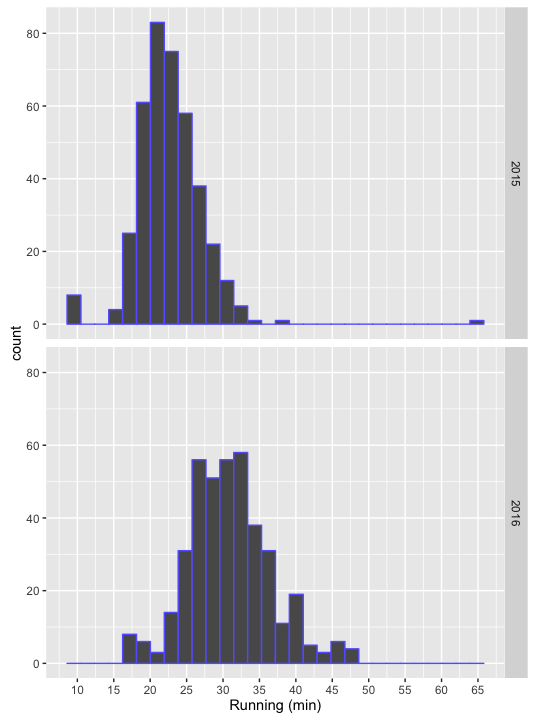
In 2015, the times of most runners were in the range of 15 - 27 minutes. In 2016, the range shifts to rather 22 - 37 minutes. This is somewhat reassuring if you have already speculated during the run that the hills in Tübingen must have become significantly steeper last year.
Admittedly, the two routes (2015 red, 2016 blue) look pretty much the same on the map. In 2015, however, the routing was such that you had to run the long straight parallel to the Neckar a total of 2 times. In 2016, the routing was the other way around and you ran through this section a total of three times.
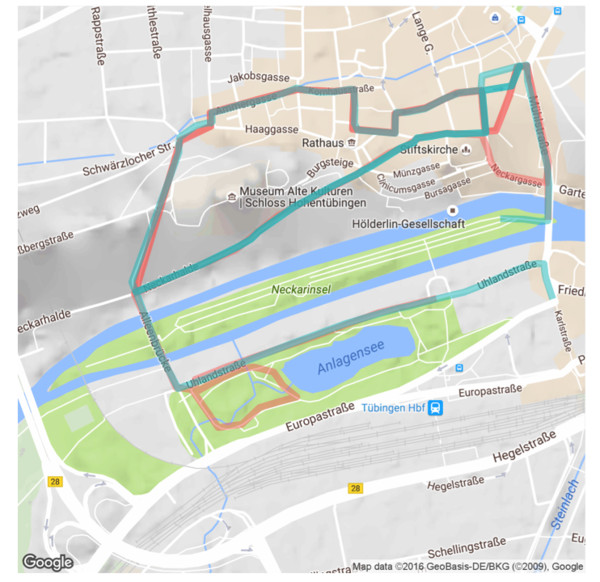
A quick measurement of the distances via Google Maps showed that the distance in 2015 was about 4.9km, while the distance in 2016 was about 5.6km. All in all, this is an explanation, but not an excuse. Next year we will train (even) more and then the longer distance will be no problem anymore ;-)