Bar charts for mean values
As part of SAS' blogparade on data visualization, Betram Schäfer (CEO of Statcon) gives advice on using bar charts.
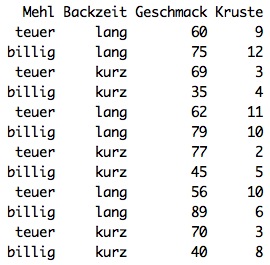
Very often in a bar chart mean values of data of a group are shown on the ordinate (Y-axis), some special features should be considered. As an example, the invented data of a baking experiment shown below shall be used:
Experiment description
These are data from a factorial experimental design in which two different flour qualities (cheap - expensive) were processed at two baking times (short-long). All other components of the recipe (flour content, water content, baking temperature, ...) remained unchanged.
Taste was measured using a group of test subjects. Each test person was asked to rate the bread on a scale from 0 (does not taste good) to 100 (tastes excellent). The data set shows the average ratings of the different test subjects for each brea
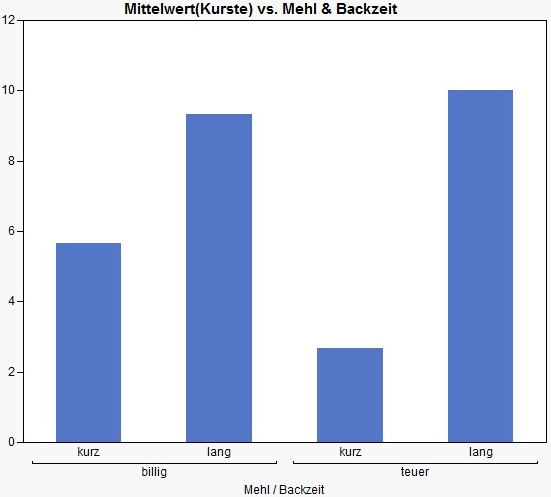
The hardness of the crust was also determined. This is done by measuring the force of a mandrel needed to break through the crust. From these data, the following averages and scatters can be easily determined. A possible way to visualize the data would be the following:
While the bar chart makes sense for the crust, it is rather questionable whether we should use a similar bar chart for the flavor. Let's assume the following diagram:
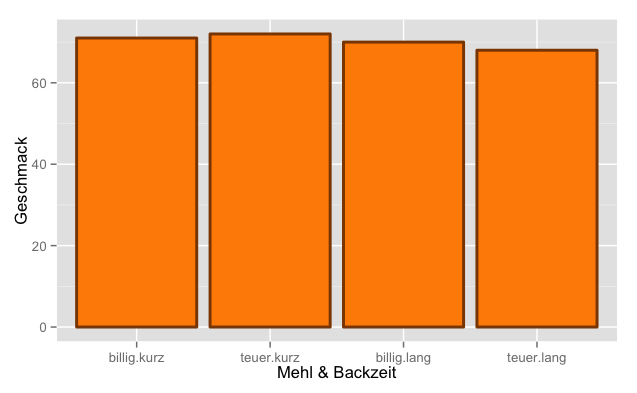
Apparently, there is no real difference in taste between the four groups. All groups seem to get a score of about 70 points. However, the bar now references the zero point as the base, that is, the worst possible score. Does this starting point make sense?
The question arises: Can there ever be a worst bread?
Is there a bread with a flavor score of 0? Although we have given arbitrary limits for the evaluation of the taste, no real technically, meaningful maximum or minimum for the evaluation of the taste is recognizable. So it is easily conceivable to adjust the Y-scale of the bar chart. A reasonable base could be anywhere, not necessarily at the 0th percentile.
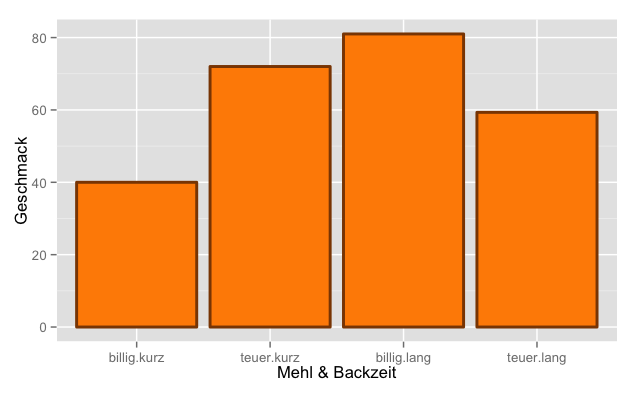
As you can see, the appearance of the graph depends dramatically on the choice of the Y-axis scale. If you take a base of 0, there seems to be no difference between the groups, if you choose a base of 67 instead, you will notice that there seems to be dramatic differences between cheap*short and cheap*long. If a graph depends so much on an arbitrary decision it cannot be suitable for an objective data analysis. Alternative: Scatter plot with error bars Unlike bar charts, scatter plots do not explicitly connect to a zero point!
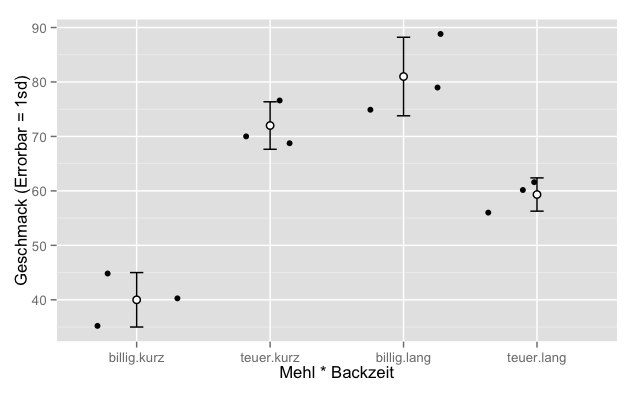
This diagram contains three components
- The actual observations (black dots)
- The group means (white dots)
- The error bars belonging to the group mean values
If you want to compare the mean values of groups, error bars are a tool to take the scatter of the data into account. Error bars are vertical lines which, starting from the mean value, can have different lengths upwards and downwards, but are usually symmetrical. The symmetry depends on the distribution of the data, the length of the error bars depends on the selected characteristic value.
Different error bars can be considered for different questions.

Induction means here that a conclusion about the population is derived from the data of a sample. For example, because the data presented are so clearly different, it is decided that in the future only the better type of flour will be used. The alternative decision for this example would be: Because the flour types differ only slightly, both flour types can be used in the future.
Special rules apply to this type of inference, which is derived based on data, and these rules also determine the type of error bars. Most bar charts for mean values, even if they contain error bars do not define the error bars, although they are shown. Obviously, the creators assume that there is only one useful type of error bar. Without a clear indication of the type of error bar selected, it cannot be interpreted and is therefore meaningles
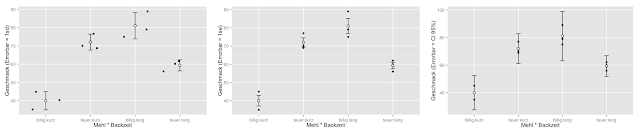
Overview of different error bars (ggplot2/R)
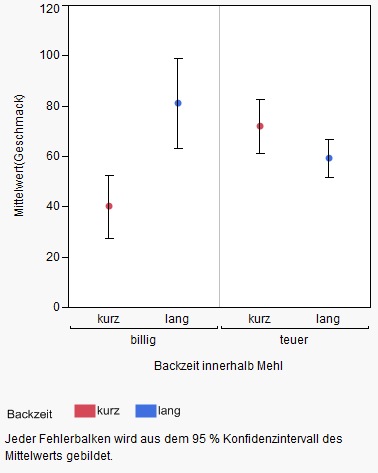
If inductive conclusions are drawn as part of the interpretation, e.g. that the two types of flour differ in average taste, the error bar must represent at least one confidence interval in order to graphically support this conclusion.
Outlook
In another entry, we will discuss special graphs for visualizing effects in different types of studies. This includes visualization in mixed models.