DoE strategy for your success
Design of Experiments is becoming increasingly popular in industry and research for optimizing products and processes and making data-driven decisions. Experiments have emerged as an invaluable tool to save time and costs. However, to take full advantage of experiment design, proper planning and an efficient strategy are necessary.
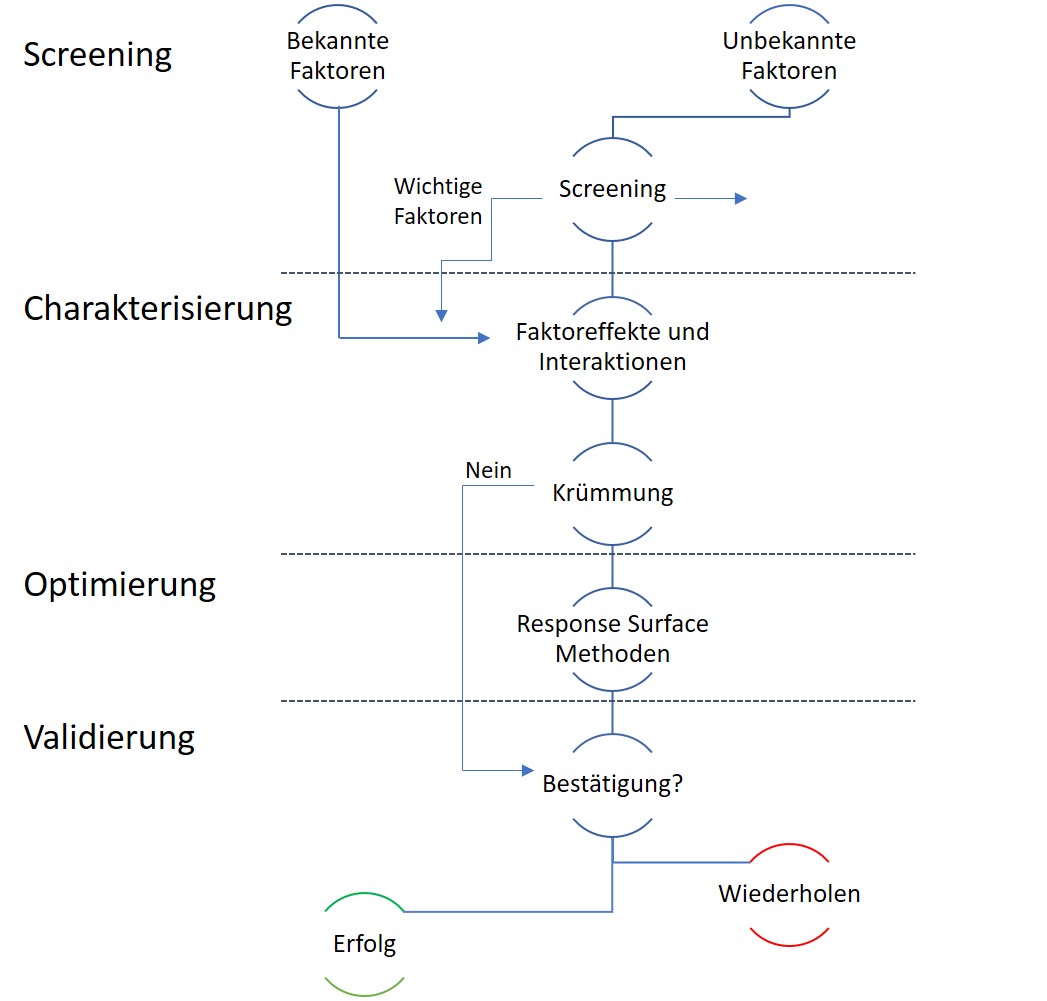
Our flowchart is a blueprint for such a strategy. Its proven core is screening, characterization and optimization. However, we have added a final, but perhaps most important step: validation.
Let's dive into the strategy for experimenters to find out why it works so well.
1. Screening for DoE
Our starting point is the screening design. Screening designs provide a solid basis for finding previously unknown process factors. TIP - Don't worry about screening factors that are already known to affect your response. Newly discovered factors - the "important few" move on to the next phase of experimentation, setting aside the "insignificant many." By using medium-resolution (Res IV) designs - color-coded yellow in the factorial experimental design of Design-Expert® software (DX) - you can look for main effects even in undetected interactions. Alternatively, if too many experimental runs tighten the budget, you can use the minimum-run screening designs in DX.
2. Characterization
When you move to characterization with the few important factors screened and factors already known, the goal is to identify two-factor interactions. This requires a high-resolution design (Res V or better) - the green ones in the DX builder. To save trials, consider a minimum-run characterization design. In any case, be sure to add center points at this stage so you can verify if curvature is present. If curvature is NOT significant, the experimental cycle is nearly complete - all that remains is validation!
3. Optimization
If the curvature turns out to be significant and important, proceed with optimization using response surface methods (RSM). The beauty of RSM is that using DX and its modeling and graphing tool, you can see where each response rises using contours and 3D graphs. Using numerical tools, DX can also determine the arrangement of factors that give the best result for multiple targets. This then results in the process window in which all specifications can be achieved simultaneously.
4. Validation
Last but not least comes the confirmation, where you run a series of tests to make sure you can reproduce the good results. DX provides a special tool for this as well. In summary, when experimenting, there is no single template that you can repeat over and over again. You need to develop a strategy that adapts to a new situation at each stage of your optimization in order to continuously improve quality and save costs. If you need help with your experiments, Statcon's experts are there to help with a wide range of training and consulting services.