Definitive Screening Designs
Since their first publication in 2011 [1], Definitive Screening Designs (DSDs) have become a standard tool in statistical experimental design. While their statistical qualities were discussed early on, there has been little material dealing with the evaluation of this type of experimental design [2].
The problem of super-saturated designs
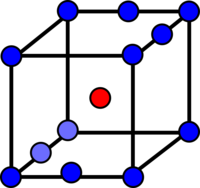
The problem of super-saturated designs Let us start with the special challenge of evaluating super-saturated designs. This will answer the question why special evaluation procedures are necessary at all to evaluate e.g. Definitive Screenings. We will investigate the influence of 6 factors on a response using a DSD with 17 trials. Now, a nice feature of DSDs is that the main effects can be estimated independently of two-way interactions and quadratic effects. Moreover, two-way interactions and quadratic effects are only partially intermingled. I.e. with the help of these designs we should be able to learn something about 2nd order effects as well. Translated with www.DeepL.com/Translator (free version)
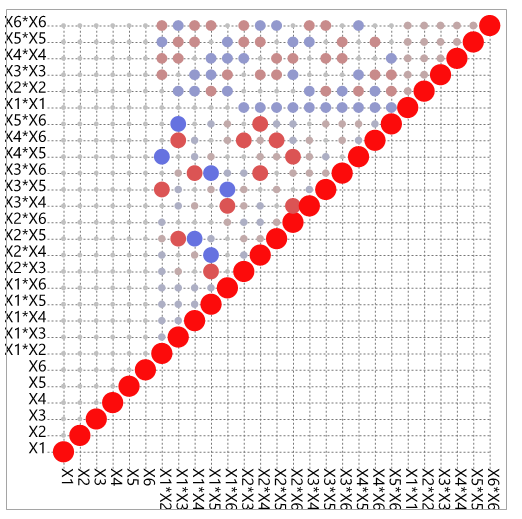
In the color matrix of the correlations one can read this property again well. The size of the circles represents the correlation between different model effects. Thus, there are some partial correlations between two-way interactions and quadratic terms. However, these are relatively small. Therefore, we should be able to make statements about main effects (ME), two-factor interactions (2FI) and quadratic effects (QE). Translated with www.DeepL.com/Translator (free version)
What is the problem now? The color matrix of the correlations measures in a way how good the distribution of the experiments in space is to make statements about the individual model effects. However, it does not take into account whether there is enough data to estimate the model.
When calculating a regression model, we need at least one data point to estimate a slope coefficient. In our case, the complete model looks like this:

This means that we would need a total of 1+6+15+6 = 28 data points to be able to calculate the complete model. It has not yet been taken into account that no p-values can be determined because no residual scatter can be calculated. Since in our case only 17 data points are available, the following problem arises:
Evaluation strategy
The evaluation methodology proposed by B. Jones [2] uses a two-step approach to circumvent this problem.
- In the first step, a regression analysis is computed for the main effects of the model alone.
- In the second step, a regression is calculated with the residuals of the regression of the first step as the target variable. Influencing factors are all 2FIs and QE resulting from the active effects of the first step.
- The active effects from the two steps are finally combined to create a final model.
Let's take a closer look at the procedure: The first step aims to identify the important main effects. Each DSD has more than enough data to estimate the main effects cleanly. So far, not much new happens except that so far 2FIs and QEs are ignored.
In the second step, the residuals of the first regression are then used as the target variable. The idea behind this is to model only the scatter in the data that was not already captured in the first model. The same idea is also used, for example, in the construction of leverage plots [3], [4].
However, splitting the data into 2 separate steps is often not enough. In this example there are still 15+6 = 21 model effects with 17 data. Here B. Jones uses the common argumentation that usually the associated main effects are significant if they also occur in an interaction. Thus, only those interactions (and quadratic effects) are examined which result from the significant main effects of the first model.
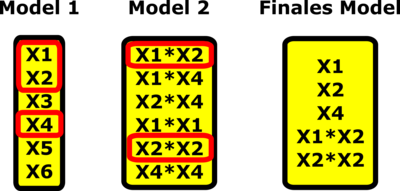
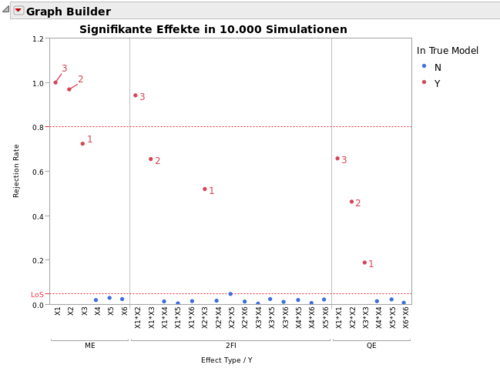
The above diagram illustrates the procedure with an example:
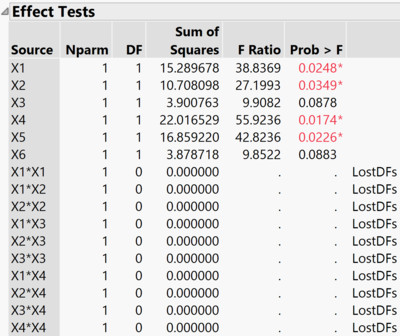
- Of all the main effects, X1, X2, and X4 prove to be significant.
- In the second step, a model is estimated for the resulting 2FIs X1*X2, X1*X4, X2*X4, and for the QEs X1*X1, X2*X2, and X4*X4.
- The final model results from the significant effects of models 1 and 2.
Simulation study as power analysis
Simulation study as power analysis A simulation-based power analysis was performed to test the efficiency of the method. For this purpose, values for the target variable were simulated for a given DSD (6 continuous factors, 17 trials). The following model was used:

The proposed method proves to be superior to various alternative methods in terms of power (see [2]). In some cursory simulation-based comparisons with AICc-based foreward regression, LASSO, and Elastic Net, the proposed method proved to be superior in each case. However, further studies are needed here.
Two points should still be explicitly mentioned:
- The method is based on the assumption that all main effects that occur in an active interaction are also active themselves. In practice, this assumption is often, but not always, fulfilled. If there are enough lines of freedom, the procedure could be extended in such a way that in the second step all 2FIs in which at least one active effect from the first model occurs are considered. Of course, this would lead to new problems, e.g. the final model would be too large to be estimated plausibly with the available data.
- Furthermore, the user should be aware that the presented evaluation routine particularly benefits from the absence of correlations between ME and 2FIs/Qes in DSDs. The two-step approach does not make sense for oversaturated designs in which aliasing between ME and 2FIs is present (partial factorial plans).
Despite this limitation, the described methodology seems to be the best systematic evaluation approach for DSDs. Even if these evaluations can be performed very easily by hand, it is much more convenient to use the corresponding route in JMP 13 [5].
Literature
- B. Jones, C.J. Nachtsheim: A Class of Three-Level Designs for Definitive Screening in the Presence of Second-Order Effects
- B. Jones: Analysis of Definitive Screening Designs bzw. mit
B. Heinen in deutsch: Auswertung von Definitive Screening Designs - W. Levin: Applied Statistical Essentials (Episode: 3 and 4)
- JMP Online Help: Leverage Plots
- JMP Online Help: The Fit Definitive Screening Plattform