Skip to main content Skip to search Skip to main navigation
Menu

Biometrics - Statistics for Life Science

Ort : Inhouse
You learn: Basic statistics, descriptive statistics and statistical graphs e.g. Bar charts, error bars, Dose-response curves. ANOVA, nonparametric tests, linear and nonlinear regression, Design of Experiments, Kaplan-Meier and Cox parametric survival
Description

Product information "Biometrics - Statistics for Life Science"

Course: Statistics for Biological and Medical Data โ€“ Fundamentals & Practical Application

This three-day course covers the basics of statistical analysis for biological and medical data. Instead of complex mathematical formulas, the focus is on practical application. Through hands-on examples, you will learn to understand and confidently apply statistical methods.

The course offers a comprehensive overview of statistical analysis methods, their applications, and potential risks โ€“ ideal for beginners and professionals looking to refresh their knowledge.

What you will learn in this course: ๐Ÿ“Š Statistics Fundamentals: Descriptive statistics & key metrics
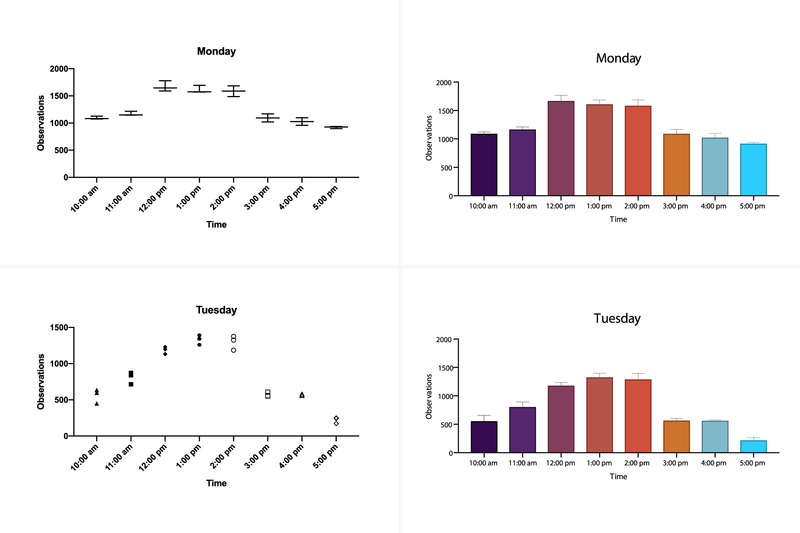
๐Ÿ“Š Interpreting Statistical Graphs: Bar charts, error bars & dose-response curves
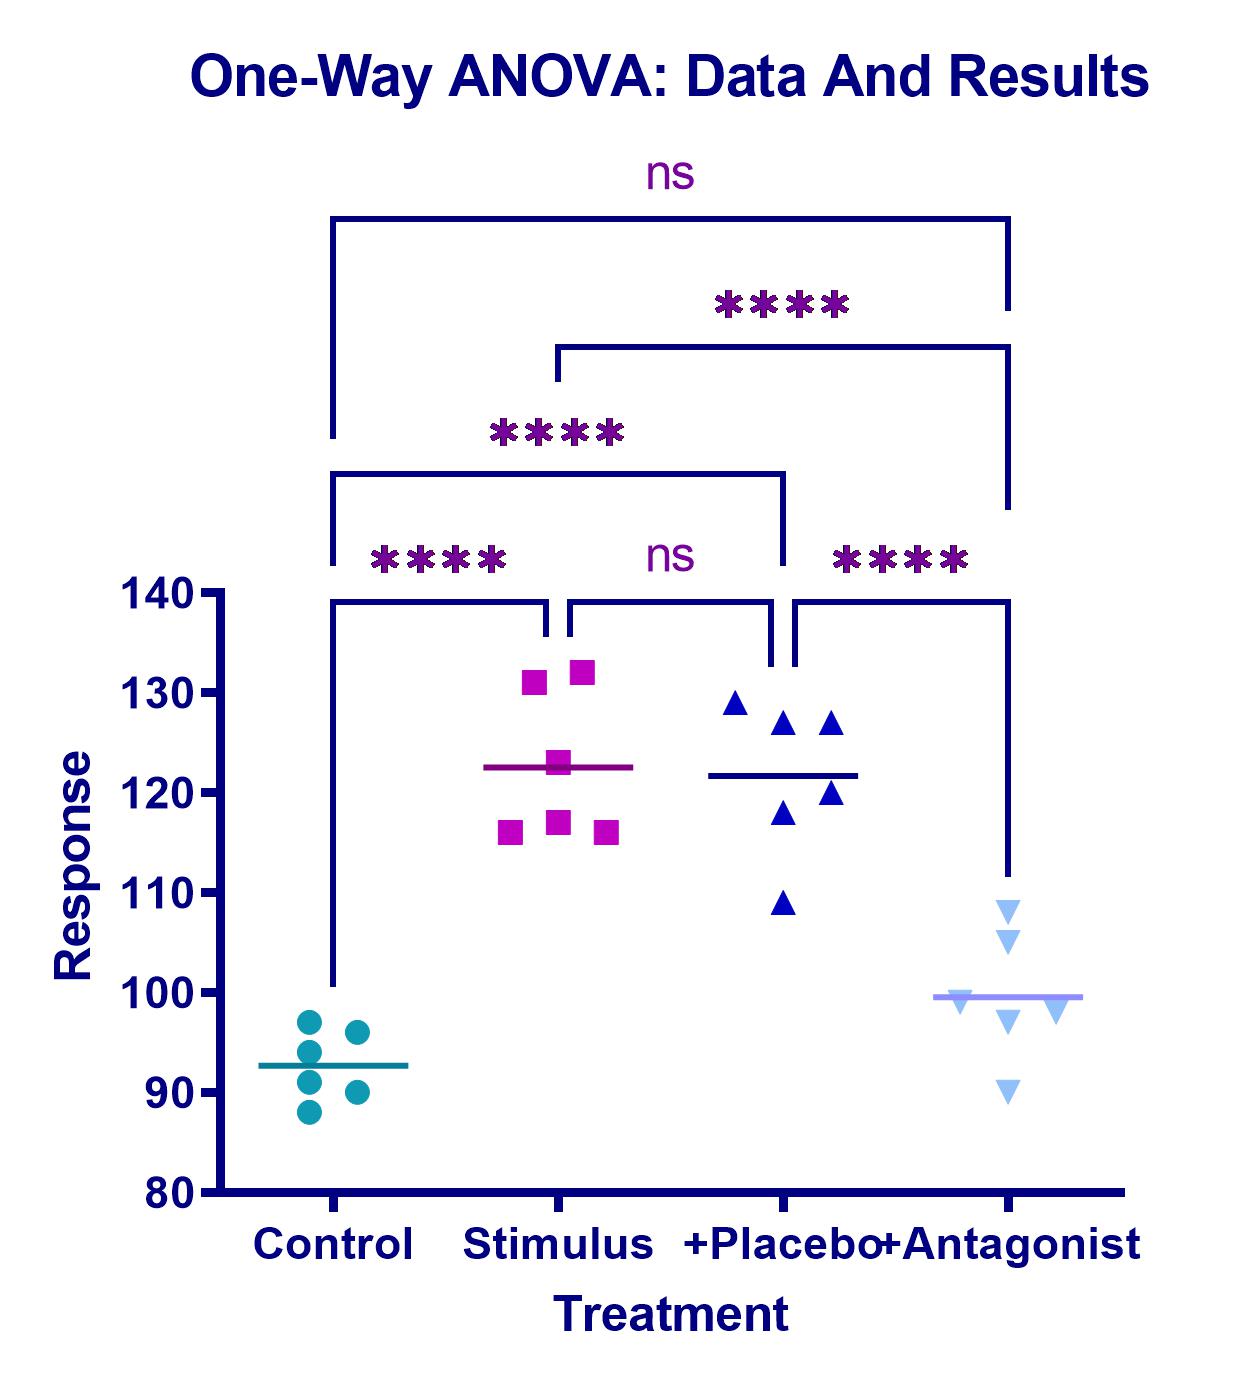
๐Ÿ“Š Hypothesis Testing & Significance Tests: t-Test, ANOVA (including Repeated Measures)
๐Ÿ“Š Nonparametric Methods: Mann-Whitney U test, Kruskal-Wallis test, Wilcoxon test, Friedman test
๐Ÿ“Š Regression Analysis: Linear & nonlinear models including dose-response curves
๐Ÿ“Š Data Validation: Data transformation, residual analysis (homogeneity of variance, normal distribution, lack-of-fit)
๐Ÿ“Š Statistical Experimental Design (Design of Experiments, DoE)
๐Ÿ“Š Survival Analysis & Models: Kaplan-Meier curves, Cox model & parametric survival models

Prerequisites:
โœ… No prior knowledge required โ€“ ideal for beginners & practitioners.

๐Ÿ•’ Course Duration: 3 days

๐Ÿ”น Sign up now and apply statistics with confidence!

Skip product gallery

Life Science

GraphPad Prism - Group Comparisons
Course: Comparative Means with GraphPad Prism โ€“ Advanced Course for Experienced Users In this two-day advanced course, you will expand your knowledge of GraphPad Prism and learn the advanced methods for comparing means. The course focuses on the statistical methods implemented in GraphPad Prism such as t-tests, ANOVA, Kruskal-Wallis, normal distribution, and post-tests. You will learn how to apply these methods, interpret them, and use them on your own data. The course provides detailed knowledge on paired and unpaired test methods as well as homogeneity of variance. This course builds on the content from the GraphPad Prism introductory course. It is essential that you are familiar with the software basics, which you can gain by attending the "GraphPad Prism โ€“ Introduction" course. Basic statistical knowledge in mean comparison will also be provided. Course contents: ๐Ÿ“Š Statistical foundations of mean comparisons ๐Ÿ“Š Confident handling of the Prism interface โ€“ mean comparison projects (data input and import) ๐Ÿ“Š Performing โ€œColumnโ€ projects ๐Ÿ“Š One Sample T-Test ๐Ÿ“Š T-Test and One-Way ANOVA for independent and paired samples ๐Ÿ“Š Non-parametric tests for independent and paired samples ๐Ÿ“Š Post-tests after mean comparisons ๐Ÿ“Š Performing โ€œGroupedโ€ projects ๐Ÿ“Š Two-Way ANOVA for independent and paired samples ๐Ÿ“Š Post-tests for Two-Way ANOVA ๐Ÿ“Š Confident use of graph types and graph design for mean comparisons ๐Ÿ“Š Interpretation of statistical metrics and summarizing results in layouts Prerequisites: ๐Ÿ“Œ This course builds on the "Introduction to Data Analysis with GraphPad Prism" course. ๐Ÿ“Œ Basic knowledge of operating GraphPad Prism and fundamental statistical knowledge are required. ๐Ÿ•’ Course duration: 2 days ๐Ÿ”น Sign up now and deepen your skills in mean analysis with GraphPad Prism!

Price on request
GraphPad Prism - Introduction
Course: Introduction to GraphPad Prism โ€“ Fundamentals of Data Analysis for Beginners In this two-day training, you will gain a solid foundation for working with GraphPad Prism, one of the leading tools for data analysis and visualization in biomedical research. You will learn the complete process of data analysis, from data acquisition to result interpretation. This course is ideal for beginners with no experience in PRISM, as well as for advanced users who want to refresh their knowledge. After the course, you will be able to use the PRISM environment confidently and conduct data analyses independently. You will be able to identify and interpret key metrics of the analysis. Course content: Day 1: Basics of GraphPad Prism ๐Ÿ“Š PRISM Interface and Project Types ๐Ÿ“Š Data Handling in PRISM: Formats, data entry, and import ๐Ÿ“Š Descriptive Statistics: Tables and basic analysis ๐Ÿ“Š Creating and Designing Graphs: Different types of charts such as bar charts, scatter plots, box plots, and Kaplan-Meier plots ๐Ÿ“Š Graphs for Paired Samples (Before-After, Repeated Measures Graphs) ๐Ÿ“Š Visualizing Variability in Graphs: Error bars, standard deviation (SD), confidence intervals (CI) ๐Ÿ“Š Exporting Results: Exporting graphs and layouts to PowerPoint and Word Day 2: Statistical Analysis with GraphPad Prism ๐Ÿ“Š Mean Comparisons: Performing t-tests, one-way ANOVA, and non-parametric tests ๐Ÿ“Š Post-Tests: Selection and execution ๐Ÿ“Š XY Projects: Creating dose-response curves, performing regressions, and interpreting the results ๐Ÿ“Š Using Post-Tests and Statistical Tools in GraphPad Prism Requirements: No prior knowledge required โ€“ the course is ideal for beginners and anyone who needs a refresher. ๐Ÿ•’ Course Duration: 2 days ๐Ÿ”น Sign up now and improve your analysis skills with GraphPad Prism!

Price on request
GraphPad Prism - Regression
Course: Regression Analysis with GraphPad Prism โ€“ Advanced Course for Experienced Users In this 2-day advanced course, you will expand your knowledge of regression analysis with GraphPad Prism. The course focuses on linear and nonlinear regression techniques used in the analysis of biological and medical data. You will learn how to analyze and interpret dose-response curves, enzyme kinetics, and model comparisons using GraphPad Prism. The course provides in-depth knowledge of residual analysis, least squares method, model fitting, and global fitting. Course Content: ๐Ÿ“Š Statistical Foundations of Regression โ€“ Introduction to linear and nonlinear models ๐Ÿ“Š Mastering the Prism Interface โ€“ Conducting regression projects (data entry and import) ๐Ÿ“Š Linear Regression โ€“ Performing and interpreting simple linear regression models ๐Ÿ“Š Nonlinear Regression โ€“ Applying and fitting nonlinear models in Prism ๐Ÿ“Š Data Visualization โ€“ Visualizing regression data in GraphPad Prism ๐Ÿ“Š Graphs and Charts โ€“ Creating and interpreting regression graphs ๐Ÿ“Š Statistical Metrics โ€“ Interpreting regression statistics and results for your analysis Prerequisites: ๐Ÿ“Œ Basic knowledge of GraphPad Prism ๐Ÿ“Œ Statistical knowledge in regression is helpful but not required ๐Ÿ•’ Course Duration: 2 days ๐Ÿ”น Sign up now and enhance your skills in regression analysis with GraphPad Prism!

Price on request
Grapher
Grapher โ€“ Powerful Software for 2D & 3D Data Visualization, Chart Creation, and Analysis Visualize Your Data Present your data with unmatched clarity and precision! Grapher offers top-tier graphing and visualization tools to help you get the most out of your data. With over 70 types of 2D and 3D charts, youโ€™ll always find the perfect way to showcase your insights professionally. โ€œGrapher is a full-featured scientific graphing program that allows users to import data in various formats, combine multiple 2D and 3D plots, and customize them down to the smallest detail.โ€ โ€“ David Suder, Principal Scientist, Precise Environmental Consultants ๐Ÿ“Š Grapher โ€“ The Software for Advanced 2D & 3D Visualization, Charting, and Analysis Analyze Your Data Donโ€™t miss hidden insights! Your data might contain valuable patterns and trends. Grapherโ€™s advanced analysis tools, statistical functions, and charting capabilities help you identify trends, uncover relationships, and discover opportunities you might otherwise overlook. โ€œGrapher has become part of my daily routineโ€”professionally, for research, and personally. I recommend it to anyone who will listen!โ€ โ€“ Stephen Ross, Japan ๐Ÿ“ˆ Get a complete view of your data with Grapher! Communicate Results Effectively Even complex datasets can be communicated clearly with Grapher. A broad range of customizable chart types helps you present ideas in a format your audience will instantly understand. Let your data speak for itself! โ€œItโ€™s truly the most flexible package on the market. I always say: If you can imagine a graph, you can create it with Grapher.โ€ โ€“ Eric Tappa, Earth & Ocean Sciences, University of South Carolina ๐Ÿ“Œ Create ternary diagrams, polar plots, and many more with Grapher! A Trusted Solution Grapher is trusted by thousands of scientists, engineers, and professionals worldwide. See for yourself why so many experts rely on this powerful data visualization software. โ€œIโ€™ve been using this software since 1987. Nothing else comes close!โ€ โ€“ Daniel J. Lombardi, P.G., Principal Hydrogeologist โœ… Experience Grapher โ€“ the professional solution for data visualization and analysis. ๐Ÿ”— Learn more and get your free trial here: โžก [Grapher Official Website]

Price on request
GraphPad Prism
GraphPad Prism โ€“ The Leading Software for Data Analysis & Scientific Visualization GraphPad Prism is the preferred statistics and graphing software designed specifically for scientific research. Researchers around the world use Prism to perform accurate data analysis, make informed statistical decisions, and present results in professional, publication-ready charts. ๐Ÿš€ Save time and improve the accuracy of your analyses with GraphPad Prism! Biostatistics & Data Analysis for Life Sciences Originally developed for biology, medicine, and pharmacology, GraphPad Prism is now widely used across the life sciencesโ€”from students and PhD researchers to scientists in the pharmaceutical and healthcare industries. โœ… Easy-to-use statistical analysis tools for scientists โœ… Automated graphing for accurate data visualization โœ… Clear, easy-to-understand results interpretation ๐Ÿ“Œ No other software offers such intuitive and powerful curve fitting! Powerful Statistical Tools in GraphPad Prism GraphPad Prism includes a wide range of statistical tests and regression models to help you analyze your research data precisely and confidently. Included Statistical Methods: ๐Ÿ“Š t-tests (unpaired & paired) ๐Ÿ“Š ANOVA (one-way, two-way, three-way) ๐Ÿ“Š Nonparametric tests ๐Ÿ“Š Linear & nonlinear regression ๐Ÿ“Š Survival analysis (Kaplan-Meier) ๐Ÿ“Š Contingency table analysis ๐Ÿ’ก Especially for nonlinear regression, Prism offers advanced tools to calculate EC50, fit complex models, and compare curves with ease. Scientific Graphing with Flexible Chart Customization With GraphPad Prism, you can create high-quality scientific graphs that update automatically when your data changes. ๐ŸŽจ Graphing Highlights: โœ… Automatically generated graphs based on your analyses โœ… Fully customizable axes, colors, labels, and layouts โœ… One-click templates for professional, consistent output ๐Ÿ“ˆ Create perfect scientific visuals in just a few clicks! Why Choose GraphPad Prism? ๐Ÿ”น Fast & easy data analysis for scientists ๐Ÿ”น Automated statistics and charting for accurate research ๐Ÿ”น Comprehensive tools for biostatistics & nonlinear regression ๐Ÿ”น Intuitive interface โ€“ perfect for students and professionals alike ๐Ÿš€ Get started with GraphPad Prism and take your scientific research to the next level! ๐Ÿ“ฅ Download your free trial now: โžก Learn more & get the free trial

Price on request
nQuery
โœ… Why Choose nQuery? ๐Ÿ“ Optimal Sample Size โ€“ Avoid underpowered or oversized studies ๐Ÿ’ฐ Cost Reduction โ€“ Save significantly on clinical trials through precise planning ๐Ÿ“ˆ Greater Efficiency โ€“ Enhance the statistical power and relevance of your results ๐Ÿง  370+ Procedures โ€“ Covers a wide range of study designs and statistical tests โš•๏ธ Trusted in Clinical Practice โ€“ Used globally by pharma, biotech & medical research institutions ๐Ÿงฌ Typical Use Cases โœ”๏ธ Clinical trials (Phases Iโ€“IV) โœ”๏ธ Medical research & epidemiology โœ”๏ธ Biostatistics & public health โœ”๏ธ Pharmaceutical development โœ”๏ธ Biotechnology & regulatory trial design ๐Ÿ› ๏ธ Key Features at a Glance ๐Ÿ”น Calculate sample size for a wide variety of statistical tests and study designs ๐Ÿ”น Perform power analysis for fixed sample sizes ๐Ÿ”น Plan studies including parallel groups, crossover designs, survival analysis, non-inferiority trials, and more ๐Ÿ”น Supports both classical and modern methodologies ๐Ÿ”น User-friendly interface with comprehensive documentation and guidance ๐Ÿ“Œ Conclusion: nQuery โ€“ Plan with Confidence. Research with Efficiency. nQuery ensures your clinical study is neither underpowered nor over-resourced. That means more reliable results, better decision-making, and optimized resource use. Get your study design right from the startโ€”with nQuery. ๐Ÿ“ฅ Discover nQuery & request your free demo today! โžก Contact us for pricing, consultation, or a personalized trial.

Price on request
SigmaPlot
๐Ÿ“ˆ SigmaPlotยฎ โ€“ Advanced Technical Graphing & Data Analysis SigmaPlot is the leading software for creating high-quality 2D and 3D scientific graphs and performing precise data analysis. Designed for researchers, engineers, and scientists, SigmaPlot generates publication-ready visuals while offering a robust set of statistical toolsโ€”making it ideal for high-level research, documentation, and scientific presentations. โœ… Why Choose SigmaPlot? ๐Ÿงช Accurate scientific visualizations in 2D & 3D ๐Ÿ“Š 50+ built-in statistical tests, including Kaplan-Meier, Bland-Altman, curve fitting & more ๐Ÿ–ผ๏ธ Publication-quality graphics โ€“ ideal for journals, reports, and conferences ๐Ÿ” Macro automation for repetitive tasks and workflows ๐Ÿ“Ž Seamless integration with Microsoft Excel, Word, and PowerPoint ๐ŸŽจ New Ribbon UI & redesigned Graph Properties dialog for faster productivity โœจ Whatโ€™s New in the Latest Version of SigmaPlot? ๐Ÿ”น Scatter matrix plots with up to 40 variables ๐Ÿ”น Filled arrowheads for precise annotation ๐Ÿ”น Multi-column sorting based on index columns ๐Ÿ”น Oneway frequency tables & new chart types ๐Ÿ”น Streamlined workflows with fewer clicks and faster graphing ๐Ÿ“Š Powerful Graphing Features โœ”๏ธ Customizable axis scales for technical presentations โœ”๏ธ Multi-axis layout support โœ”๏ธ Regression analysis & nonlinear curve fitting โœ”๏ธ Automatic error bars & confidence intervals โœ”๏ธ Enzyme kinetics & specialized scientific chart types ๐Ÿง  Built-In Statistics Advisor SigmaPlot includes a Statistics Advisor that guides you to the right statistical test and walks you through its application step by step. ๐Ÿ“Œ Examples include: โ€ข t-tests, ANOVA, nonparametric tests โ€ข Kaplan-Meier survival analysis โ€ข Bland-Altman method comparison โ€ข Regression models & curve fits โ€ข Enzyme kinetics and more ๐Ÿ”„ Optimized for the Microsoft Office Workflow ๐Ÿ”— One-click data import from Excel ๐Ÿ“„ Insert SigmaPlot charts directly into Word & PowerPoint ๐Ÿ“ค Export high-resolution graphics for publication or presentation ๐ŸŽฏ Conclusion: SigmaPlot โ€“ When Your Research Demands Clarity Whether in medicine, life sciences, chemistry, physics, or engineering, SigmaPlot delivers everything you need for professional-level data visualization and analysis. Intuitive to use, powerful in output. ๐Ÿ“ฅ Learn more or request a free trial: โžก Visit the official SigmaPlot product page: www.systat.com/products/sigmaplot

Price on request
JMP - Introduction and Exploratory Data Analysis
Course: Introduction to JMP โ€“ Graphical Data Analysis and Exploratory Data Analysis (EDA) In this one-day course, you will be introduced to JMP, the powerful software for graphical data analysis. You will learn how to conduct exploratory data analysis (EDA) and identify patterns in your data. The course will teach you not only how to navigate the JMP interface, with its menus, dialogs, and reports, but also techniques for data management such as importing, exporting, and transposing data. You will also learn how to create and interpret descriptive statistics and present your results visually. Course Content:ย ๐Ÿ“Š Data Import โ€“ Importing data from various sources into JMP ๐Ÿ“Š Software Navigation โ€“ Efficient use of the interface, menus, and reports ๐Ÿ“Š Data Management โ€“ Working with column and row menus, transposing and organizing data ๐Ÿ“Š Descriptive Statistics โ€“ Creating and interpreting basic statistical metrics ๐Ÿ“Š Graphical Data Analysis โ€“ Performing EDA techniques for pattern recognition in data ๐Ÿ“Š Result Presentation โ€“ Exporting analysis results and creating reports Prerequisites: ๐Ÿ“Œ No prior knowledge required ๐Ÿ•’ Course Duration: 1 Day ๐Ÿ”น Register now and begin your journey into the world of data analysis with JMP!

Price on request