Funktionen in Analyse-it
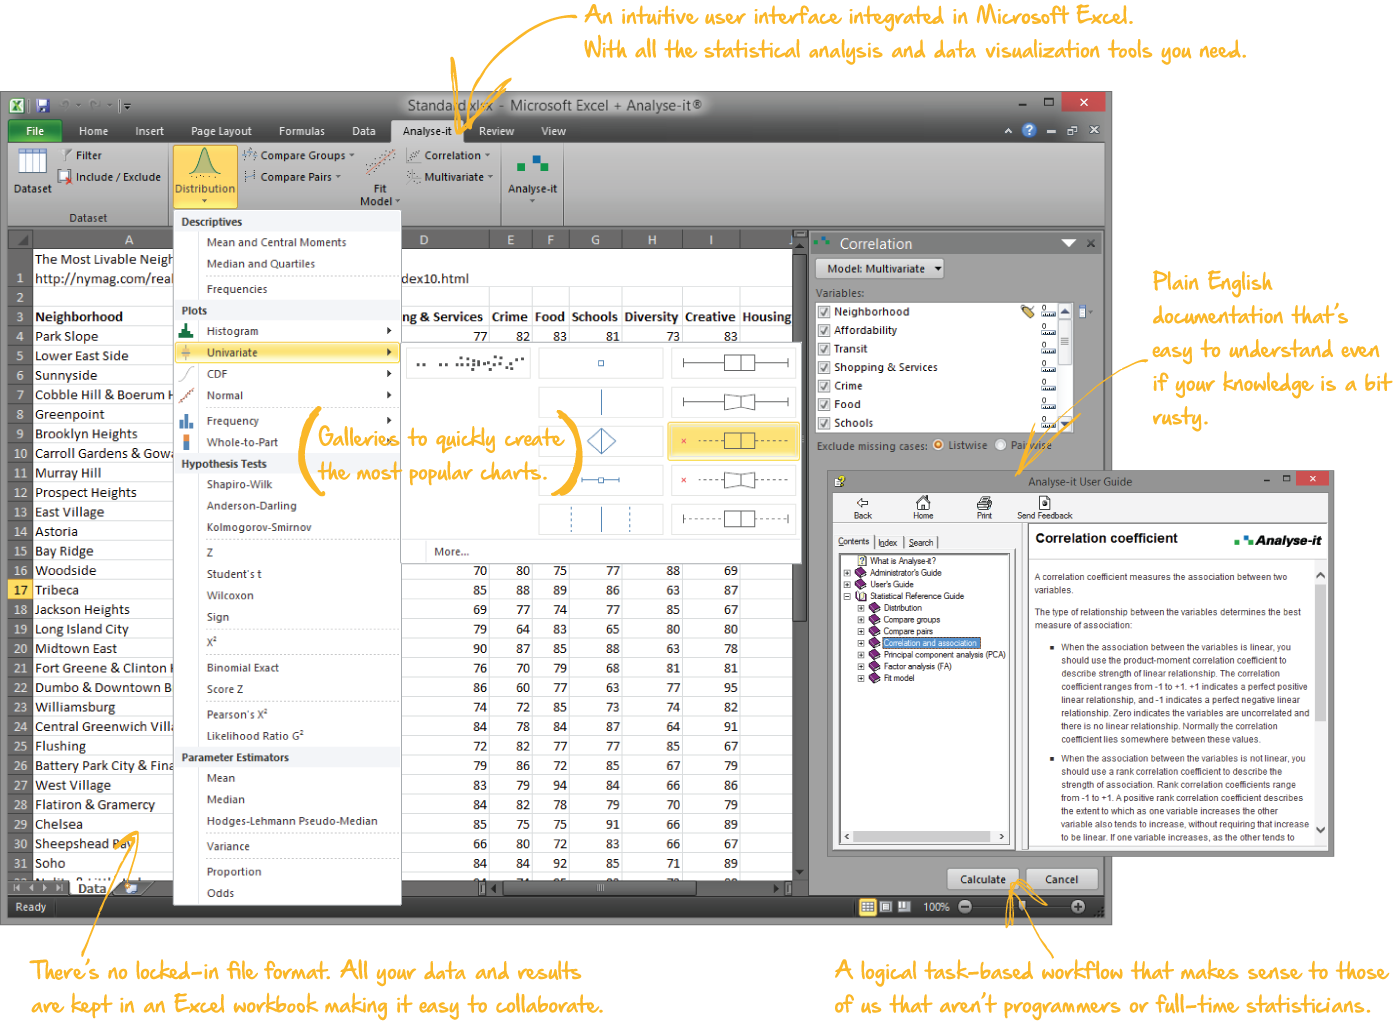
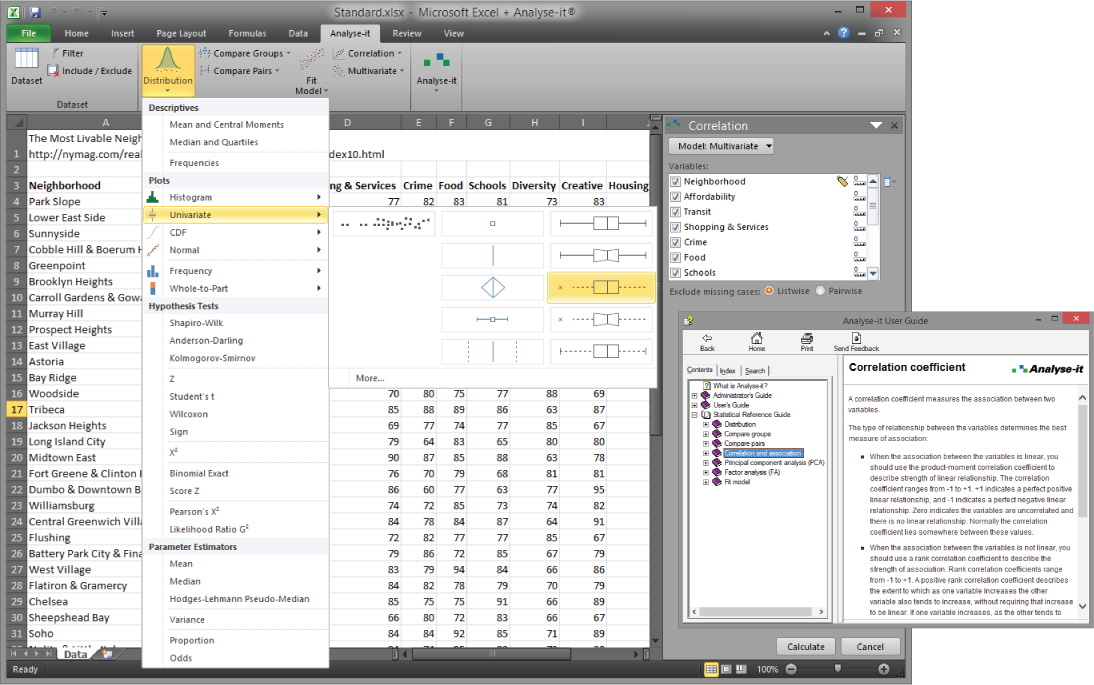
Deskriptive Statistik
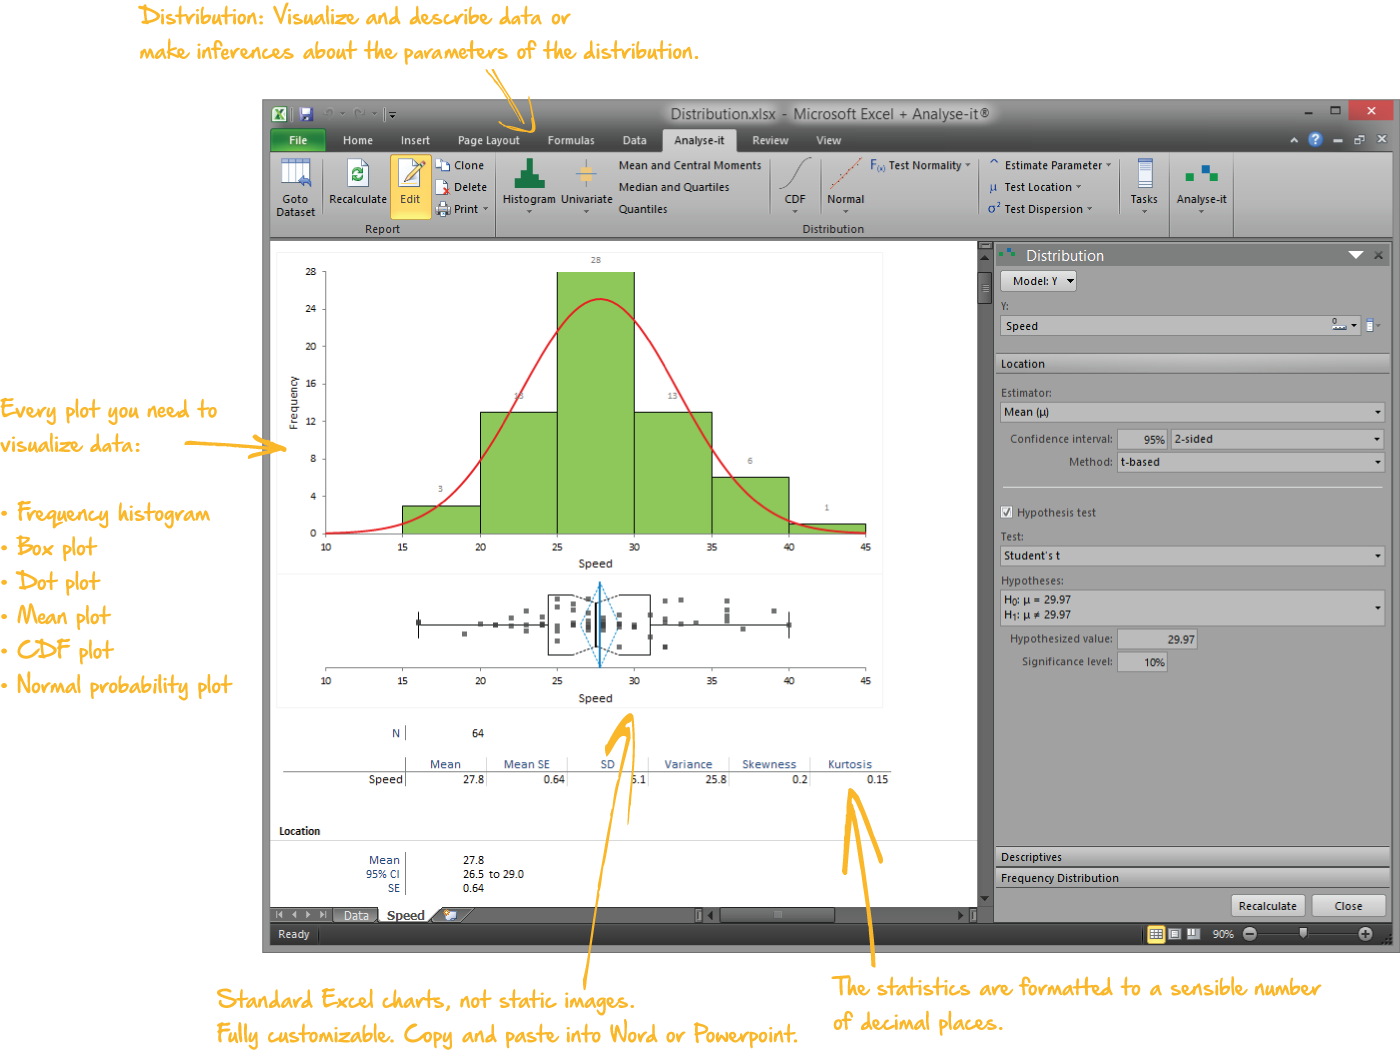
- Mean, Variance, SD, Skewness, Kurtosis
- Median, Minimum, Maximum, Range, IQR
- Quantiles
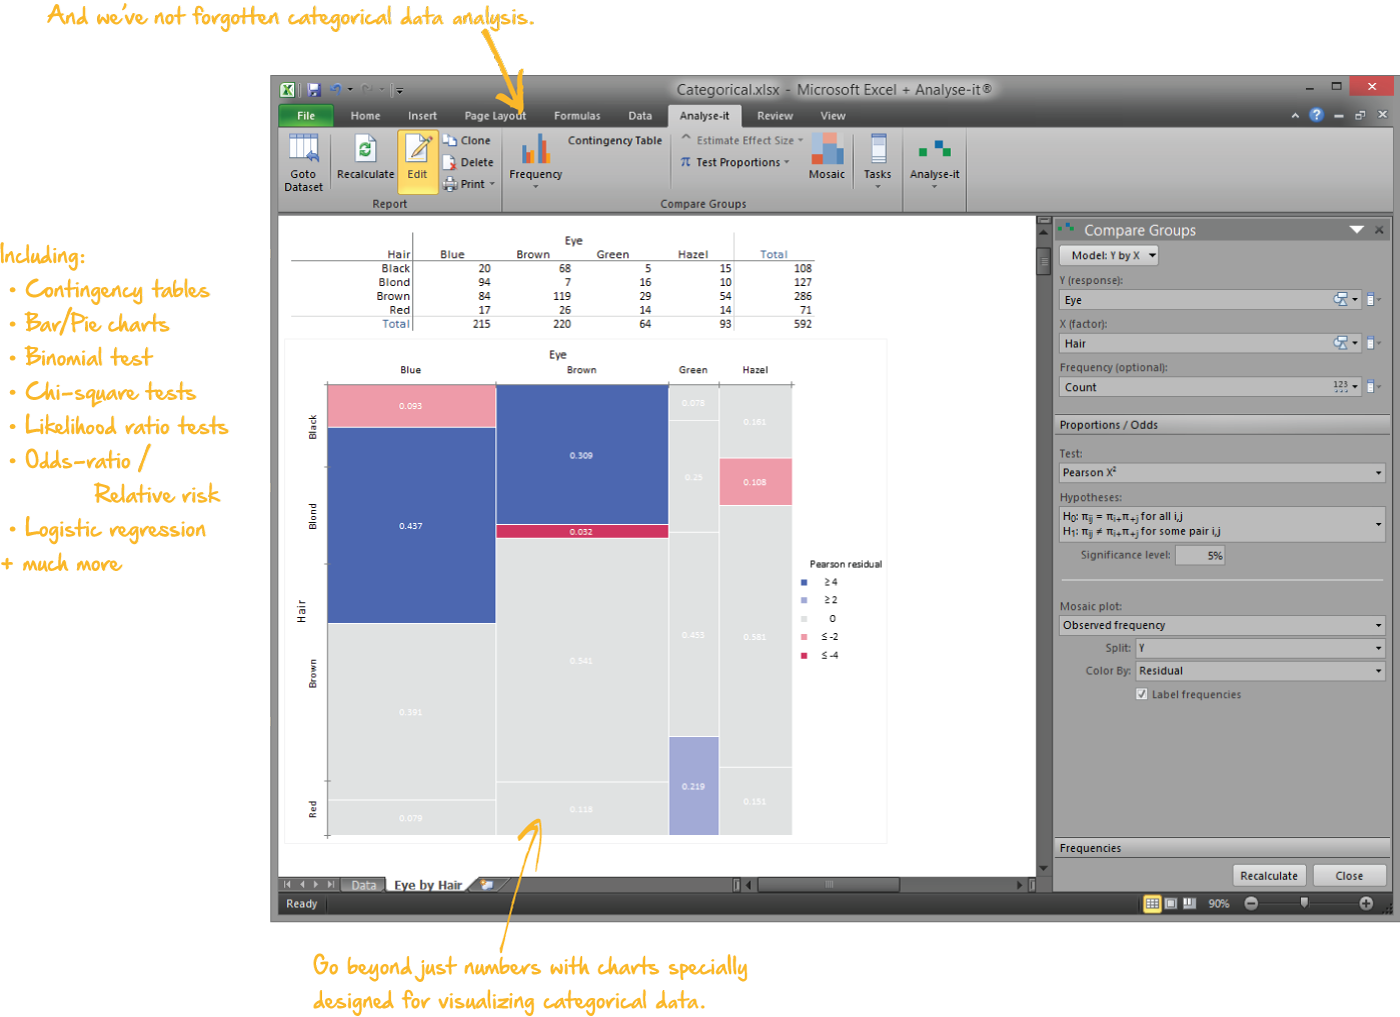
- Frequency table
- Contingency table
- Correlation coefficient
Multivariate
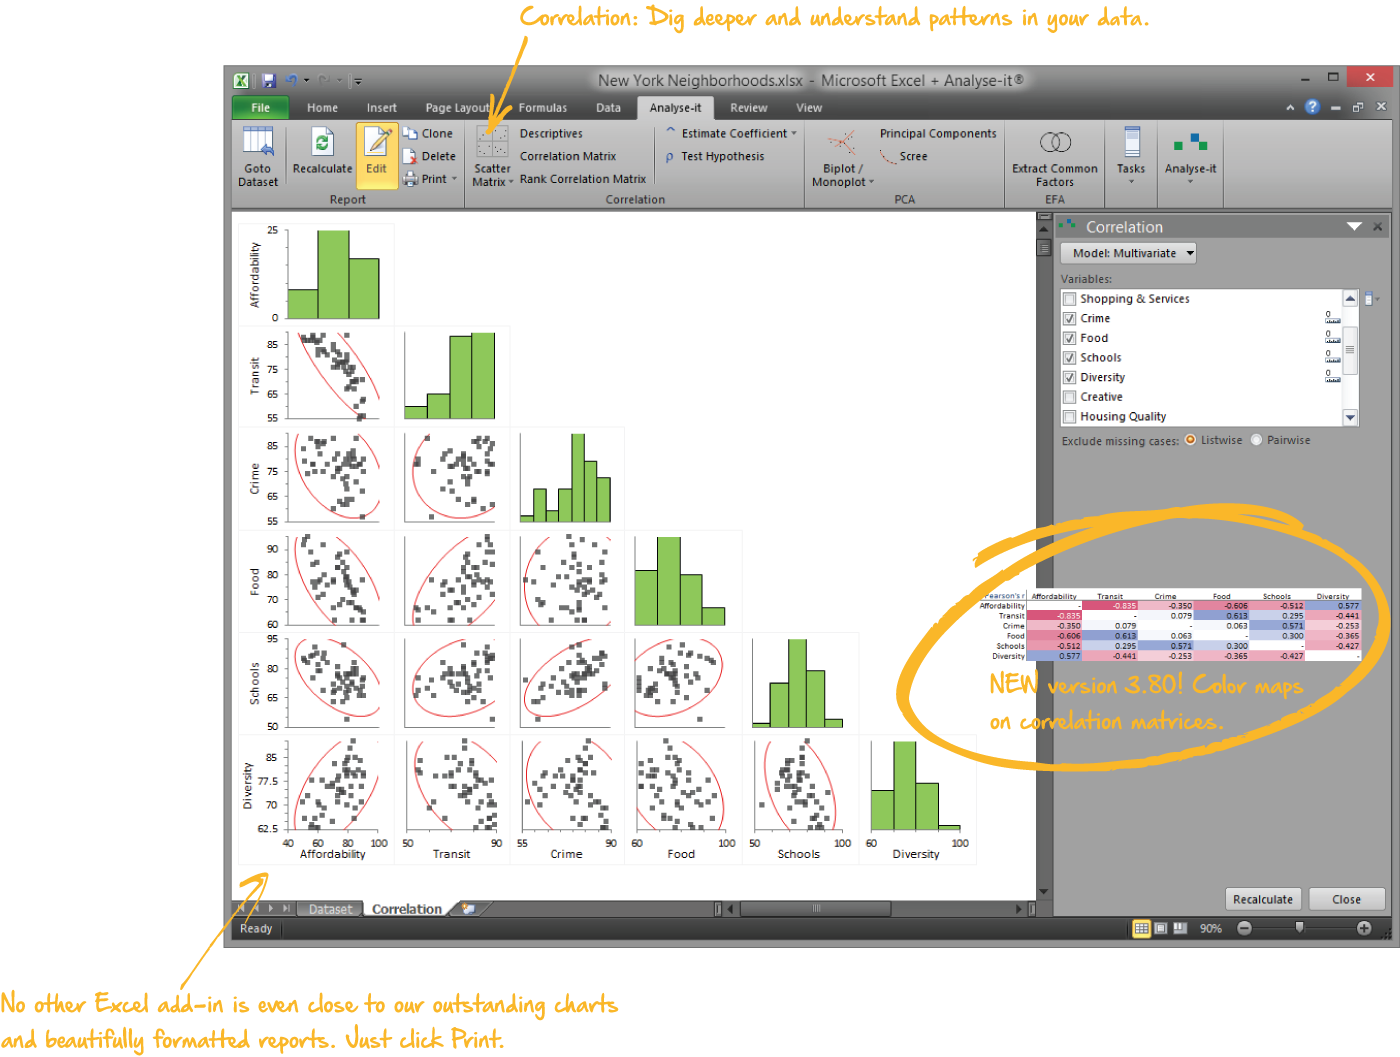
Correlation
- Pearson
- Spearman
- Kendall
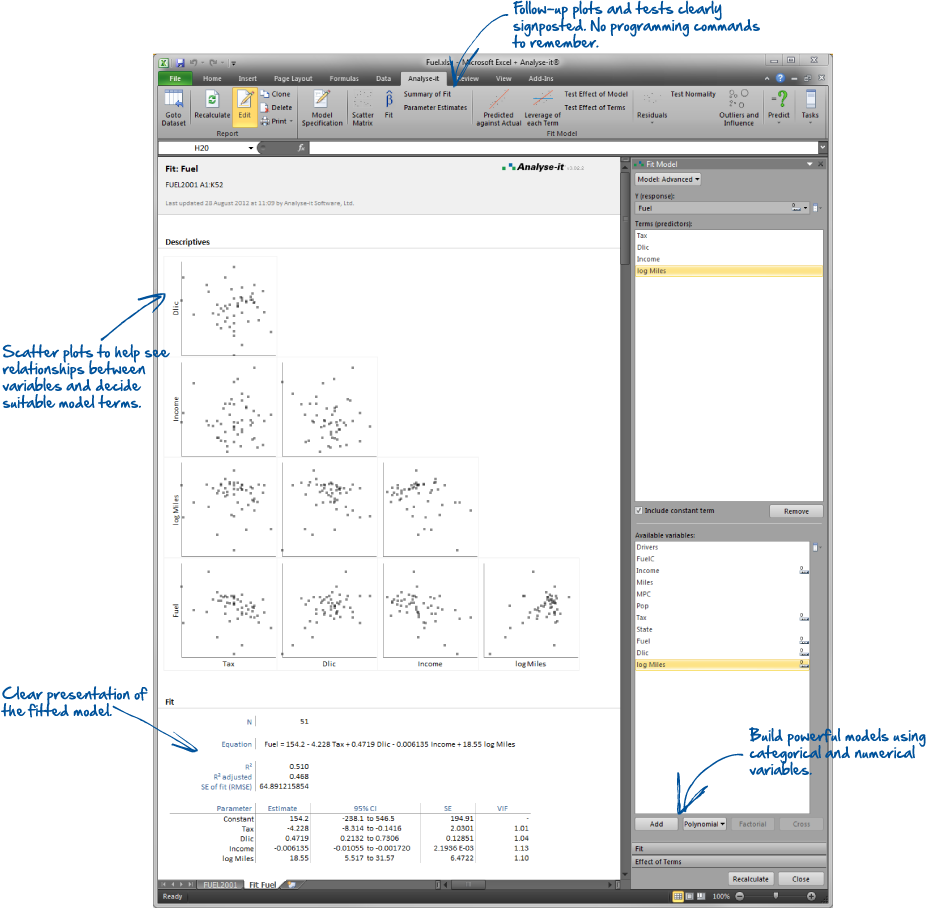
- Scatter plot matrix
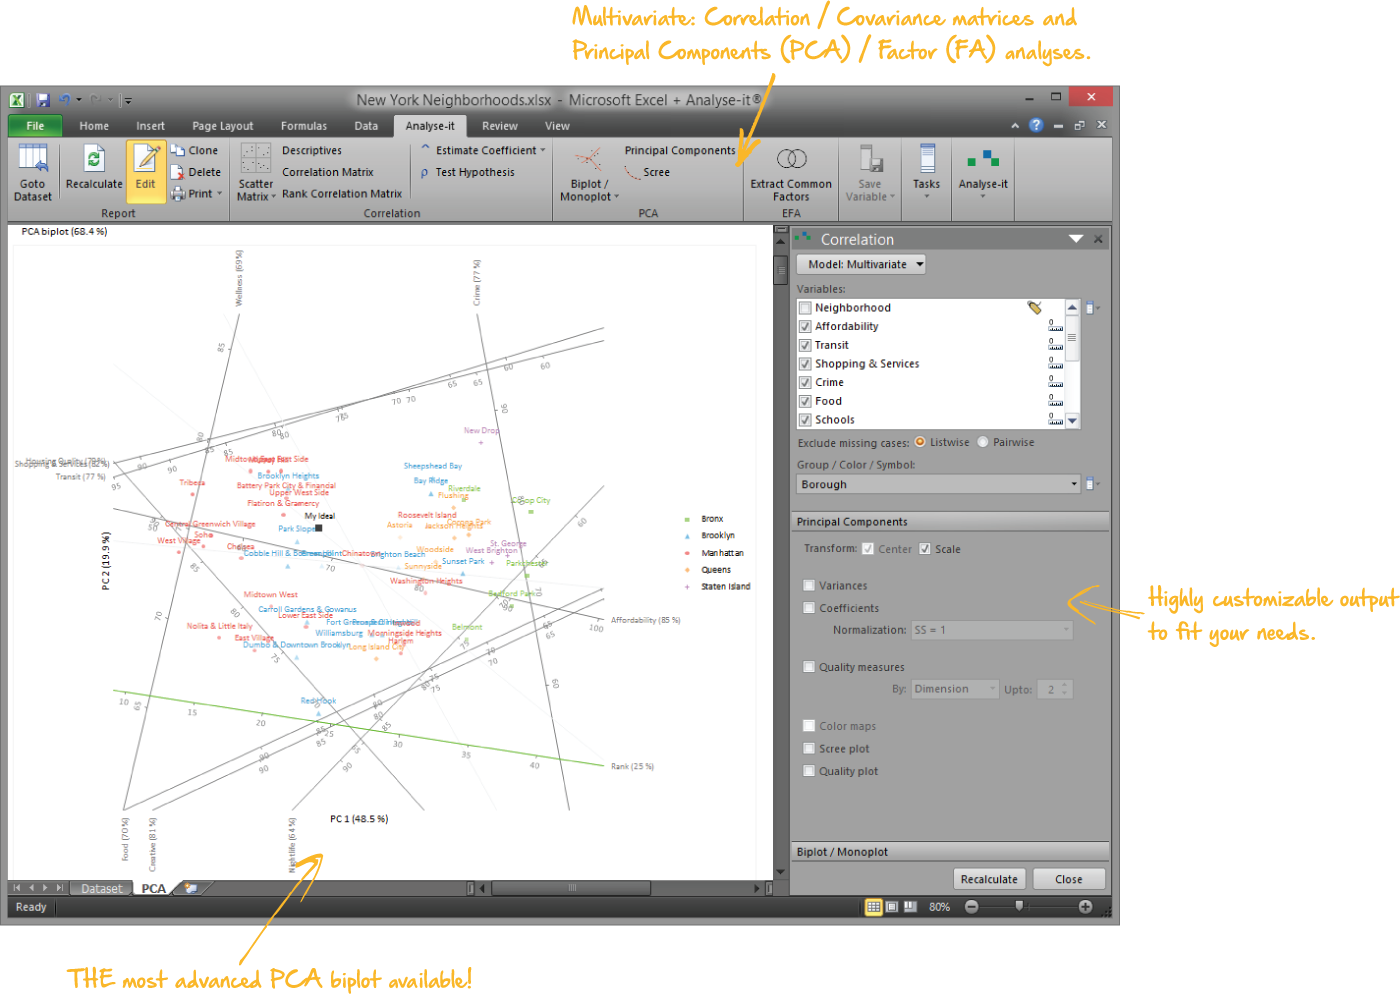
Principal Component Analysis (PCA)
- Variance, coefficients, scores
- Scree plot
- Biplot/Monoplot - PCA/Correlation/Covariance
Modellierung und Regression
Linear Fits
- Simple linear regression
- Polynomial regression (2nd to 6th order)
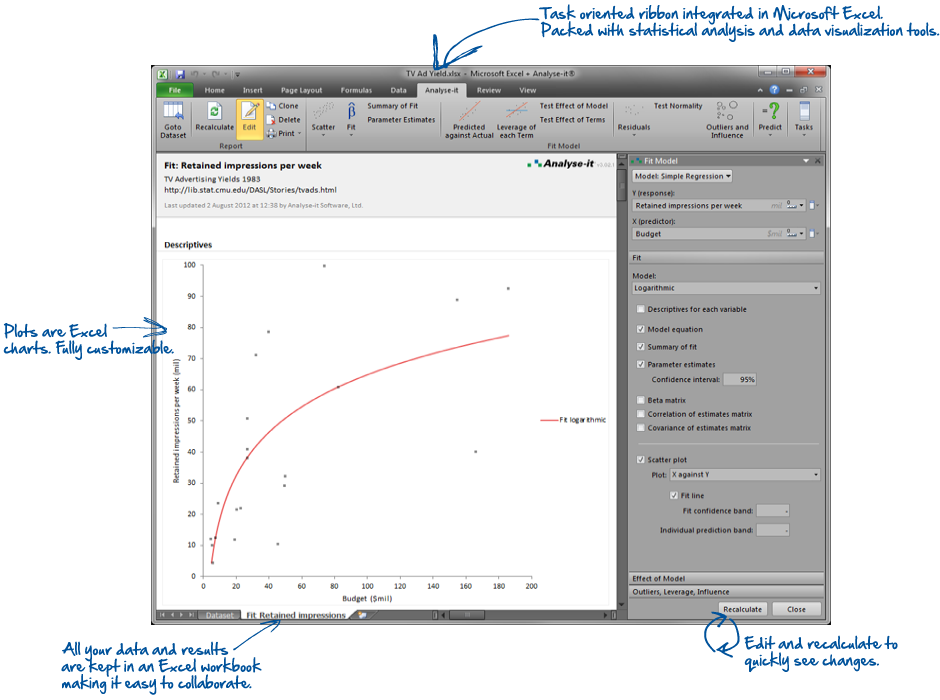
- Logarithmic regression
- Exponential regression
- Power regression
- Multiple linear regression
- Advanced models with simple, crossed, polynomial and factorial terms, with categorical explanatory variables coded as dummy variables
Other Fits
- Binary logistic regression
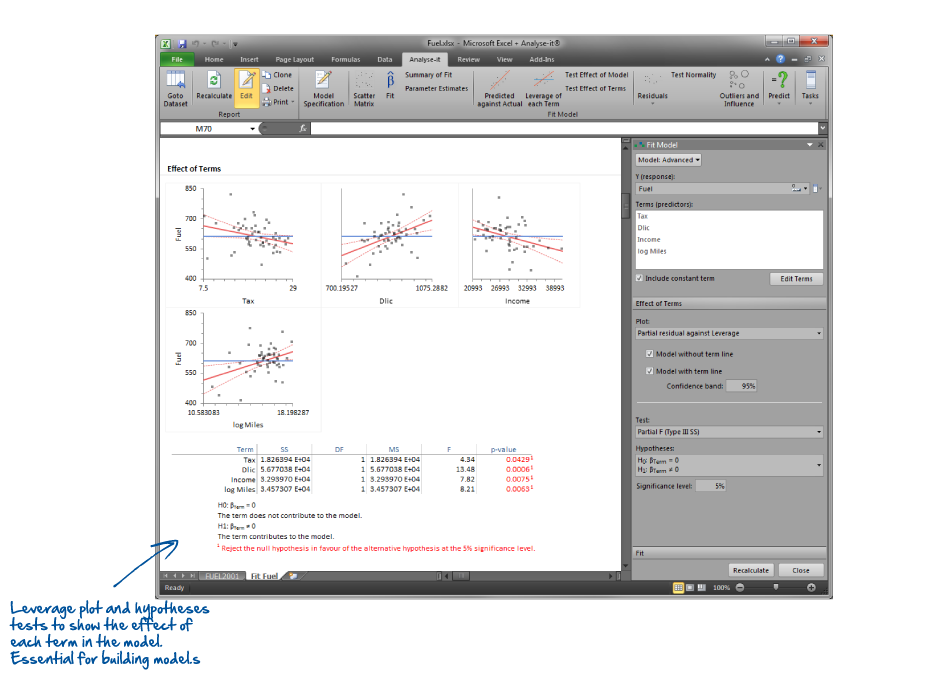
- Leverage plot
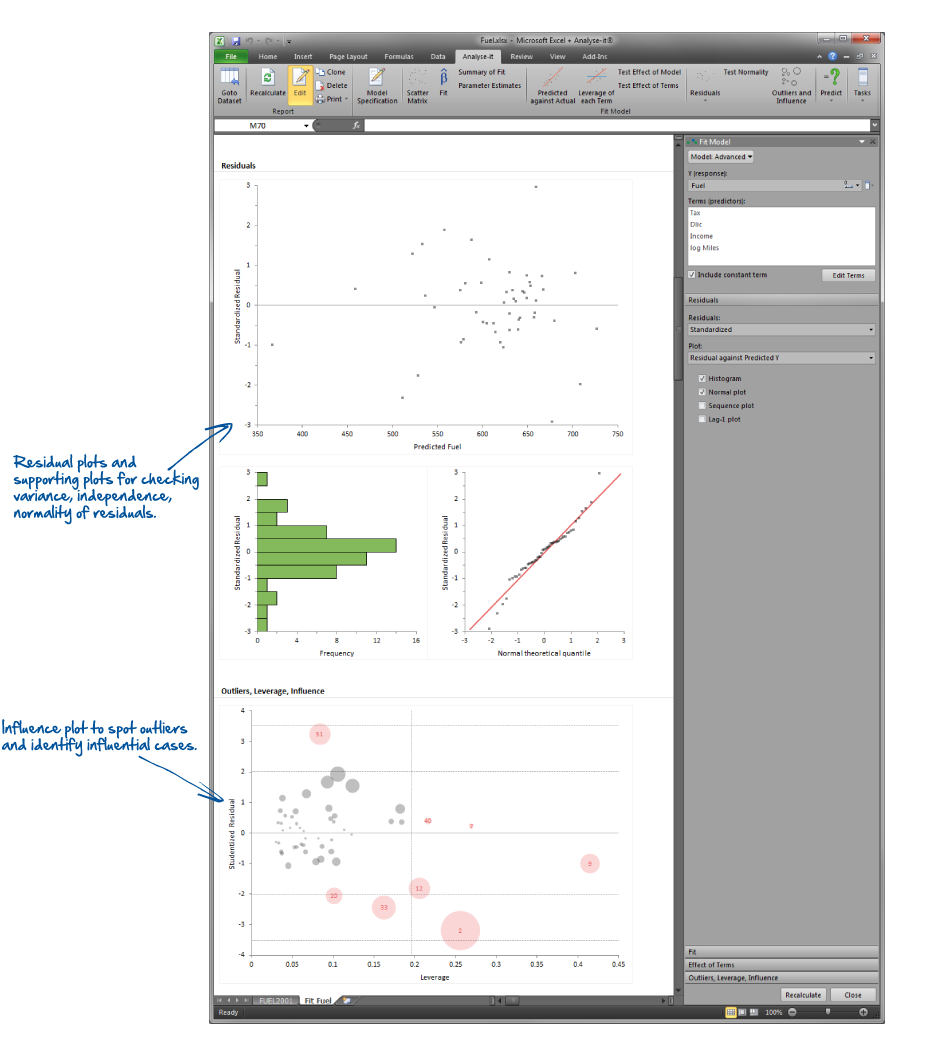
- Residual plot
- Outlier and Influence plot
- Standardized and Studentzied residuals
- Cook's D
- Test effect of each term
- Test effect of model
- Predict Y for X
- Lack of fit test for simple regression models
- Save model variables back to the dataset: Fitted Y, Residuals, Standardized Residuals, Studentized Residuals, Leverage, Cook's Influence.
Hypthosen-Tests
Location
- Z-test (one, two, paired)
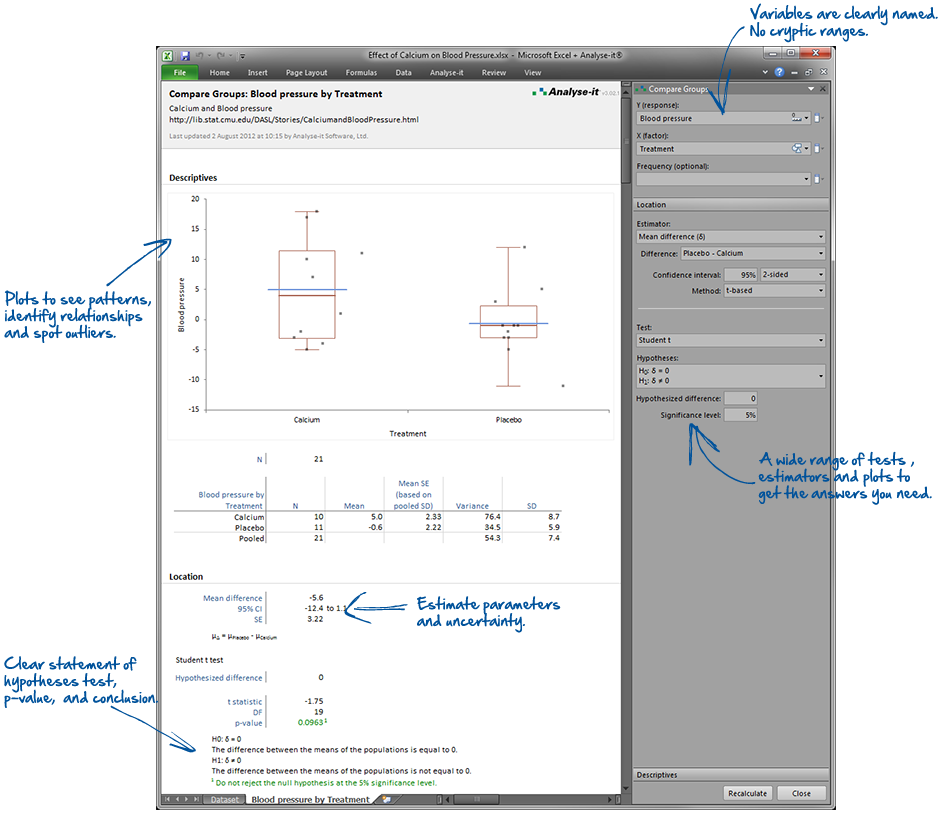
- Student t-test (one, two, paired)
- Welch t-test
- Wilcoxon
- Wilcoxon-Mann-Whitney
- Sign
- ANOVA
- Repeated measured ANOVA
- Welch ANOVA
- Kruskal-Wallis
- Friedman
Dispersion / Homogeneity of variance
- X2
- Fisher F-test
- Bartlett
- Levene
- Brown-Forsythe
Normality
- Shapiro-Wilk
- Anderson-Darling
- Kolmogorov-Smirnov
Association
- Kendall test
- Spearman test
- Pearson test
Proportions
- Binomial exact
- McNemar-Mosteller exact
- Fisher exact
- Pearson X2
- Score Z
- Likelihood ratio G2
Schätzungsfunktionen
Location
- Mean
- Median
- Hodges-Lehmann pseudo-median
- t-based confidence interval for mean
- Z-based confidence interval for mean
- Thompson-Savur confidence interval for median
- Tukey confidence interval for Hodges-Lehmann pseudo-median
- Mean difference
- t-based confidence interval for mean difference
- Z-based confidence interval for mean difference
- Welch-Satterthwaite t-based confidence interval for mean difference
- Hodges-Lehmann location shift
- Tukey confidence interval for Hodges-Lehmann location shift
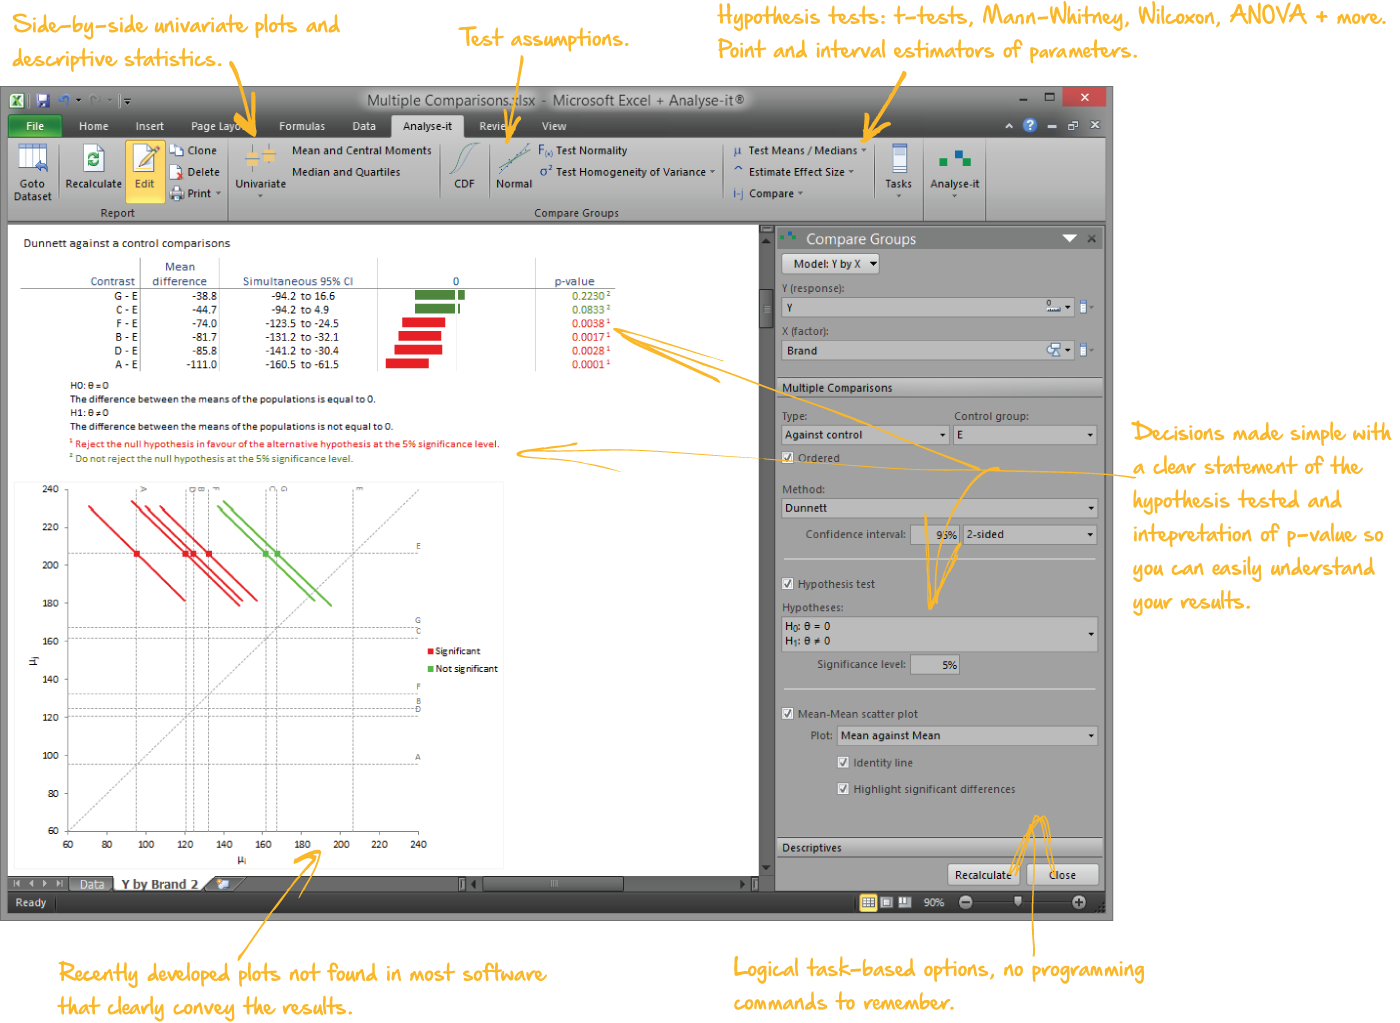
- Multiple comparisons: Tukey-Kramer, Dunnett, Hsu (with best), Scheffe (all contrasts), Steel (non-parametric against control), Dwass-Steel-Critchlow-Fligner (non-parametric all pairs), Wilcoxon (individual comparisons)
Dispersion
- Variance
- X2-based confidence interval for variance
- Variance ratio
- F-based confidence interval for variance ratio
Proportions
- Proportion
- Odds
- Clopper-Pearson exact confidence interval for proportion
- Wilson score confidence interval for proportion
- Proportion difference (risk difference)
- Proportion ratio (risk ratio)
- Odds ratio
- Miettinen-Nurminen score confidence interval for proportion difference / proportion ratio / odds-ratio
- Newcombe score confidence interval for proportion difference
- Conditional exact confidence interval for odds ratio
Correlation
- Pearson r
- Fisher Z confidence interval for Pearson r
- Spearman rs
- Kendall tau
- Samara-Randles confidence interval for Kendall tau
Plots
- Histogram
- Dot plot
- Box plot
- Mean error bar plot
- CDF plot
- Normal Q-Q plot
- Scatter plot
- Scatter plot matrix
- Difference plot
- Mean-Mean scatter plot for visualizing multiple comparisions.
- Frequency plot
- Pie frequency plot
- Mosaic plot
- Grouped frequency plot
- Stacked frequency plot


